What Is OpenTelemetry?
This OpenTelemetry overview will provide insight into how developers can add this tool into their observability stack.
Estimated time to read: 6.5 min
OpenTelemetry, or OTEL, is a vendor-neutral and open-source observability framework that allows developers to generate, collect, and manage telemetry data from distributed systems. With OTEL, developers use standardized instrumentation for easy observation and troubleshooting of a single application or complex environment with a microservices-based architecture.
OTEL provides a comprehensive set of APIs and SDKs for collecting telemetry data across multiple languages, platforms, and technologies. It also supports different telemetry data types, including traces, logs, and metrics, making it an all-in-one observability solution.
Before adding OTEL to your observability stack, it is important to understand how and why this tool was developed. In this article, we’ll study the origin of OTEL, outline how it is used, and break down its main features.
The Origin of OpenTelemetry
OTEL is the result of a merger between two popular observability frameworks: OpenTracing and OpenCensus. OpenTracing, a project initiated by co-founder of Lightstep Ben Sigelman, standardized the way developers instrument their code for tracing. OpenCensus was a similar project led by Google, and standardized metrics and instrumentation for distributed tracing.
In May 2019, OpenTracing and OpenCensus merged to form OpenTelemetry. OpenTelemetry then moved under the administration of The Cloud Native Computing Foundation (CNCF) in October 2019. This vendor-neutral organization supports open-source projects in the cloud-native ecosystem.
Simplifying and standardizing systems to dodge challenges
OpenTelemetry enables developers to avoid common challenges that arise when monitoring complex computer systems. In this section, we will study how OTEL counters common challenges, including an increasingly diverse application portfolio, and applications that run on different rules.
OpenTelemetry and vendor neutrality
Before OTEL, observability frameworks were mostly vendor-specific, meaning that developers often had to use various, non-open-source tools and APIs to instrument their applications. This enabled a single vendor the ability to ‘lock-in’ — making it difficult to switch providers or use multiple providers at the same time, as each one has its own way of collecting telemetry data.
With OTEL, developers can use a single set of APIs and SDKs to instrument their applications, regardless of the cloud provider they are using. This allows for greater flexibility and vendor neutrality since telemetry data can be collected and analyzed in a uniform way across different providers.
Instrumentation for increased observability
For any developer or operations manager, there is an obvious and ever-present need for observability, or insight, into your system to troubleshoot and optimize distributed systems. While there are many tools that can offer observability capabilities, OTEL enables observability through a standardized way of instrumenting applications.
Instrumentation can be defined as adding code to an application to generate telemetry data. With OTEL, developers can instrument their applications once and then observe these applications with numerous tools, such as distributed tracing systems, log aggregation platforms, and metrics analysis tools.
Ultimately, with OTEL, developers can see how requests flow through different services, identify bottlenecks and errors, and monitor key performance indicators (KPIs) in real time.
Instrument once, observe from anywhere
One of the key benefits of OTEL is the ability to instrument applications once and then observe them with multiple tools. This means that developers can choose the best tools for their needs without having to worry about how the telemetry data is collected. It also means each team can select different tools for the same data and that the observation tool can be quite easily changed.
Telemetry data provides insight into system health and performance
OTEL supports three types of telemetry data: metrics, logs, and traces. Together, these provide a comprehensive view of the health and performance of distributed systems.
Metrics are numerical values that give rapid insight into how a system or application is performing. They are used to monitor KPIs and alert on anomalies.
Logs are textual records of events that occur within an application or system. They typically contain much more information than metrics, which is very useful for debugging, auditing, and compliance purposes.
Traces are sequences of events that occur when processing a single request or transaction. They are used to visualize the flow of requests through a distributed system and identify bottlenecks and errors. They also show the path the request has taken in the application.
Standardization of instrumentation to reduce complexity
One of the primary goals of OTEL is to standardize the way developers instrument their applications for observability. This is important because standardization reduces complexity and facilitates the adoption of new tools and technologies.
OTEL provides a set of standard APIs and SDKs for different programming languages, better enabling developers to instrument applications consistently. In this way, developers can use the same instrumentation code regardless of the cloud provider or tool they are using.
Standardization also makes it easier to share telemetry data between tools and systems. For example, if a developer collects traces using OTEL, they can export those traces to various distributed tracing systems, like Jaeger or Zipkin, without having to modify the instrumentation code.
This standardization of instrumentation also allows for easier collaboration between teams. Developers using the same standards can share best practices and code snippets for instrumenting applications, making it easier to troubleshoot and optimize complex distributed systems.
How OTEL uses SDKs and APIs to provide observability
OTEL relies on SDKs and APIs to work together and provide developers with a complete observability solution.
SDKs/APIs
OTEL provides SDKs and APIs for popular programming languages so that developers can instrument their applications for observability. These SDKs and APIs are designed to be easy to implement and give developers the flexibility to customize their instrumentation as needed. Developers can then send telemetry data to the Collector.
Collector
The Collector first receives telemetry data from different sources, such as applications and microservices. It then processes and aggregates this data before sending it to its Exporters. The Collector thus has three main parts:
Receivers ingest incoming data from various formats and protocols.
Processors transform telemetry data before it is sent to the Exporters; they filter, aggregate, or enrich telemetry data as needed.
Exporters send telemetry data to various backends, such as monitoring tools or logging systems like Jaeger, Prometheus, and Zipkin
The Features of OpenTelemetry
The OpenTelemetry standard offers a wide range of features that make it a powerful and convenient observability framework for modern cloud-native applications. Let’s take a look at several of its key benefits.
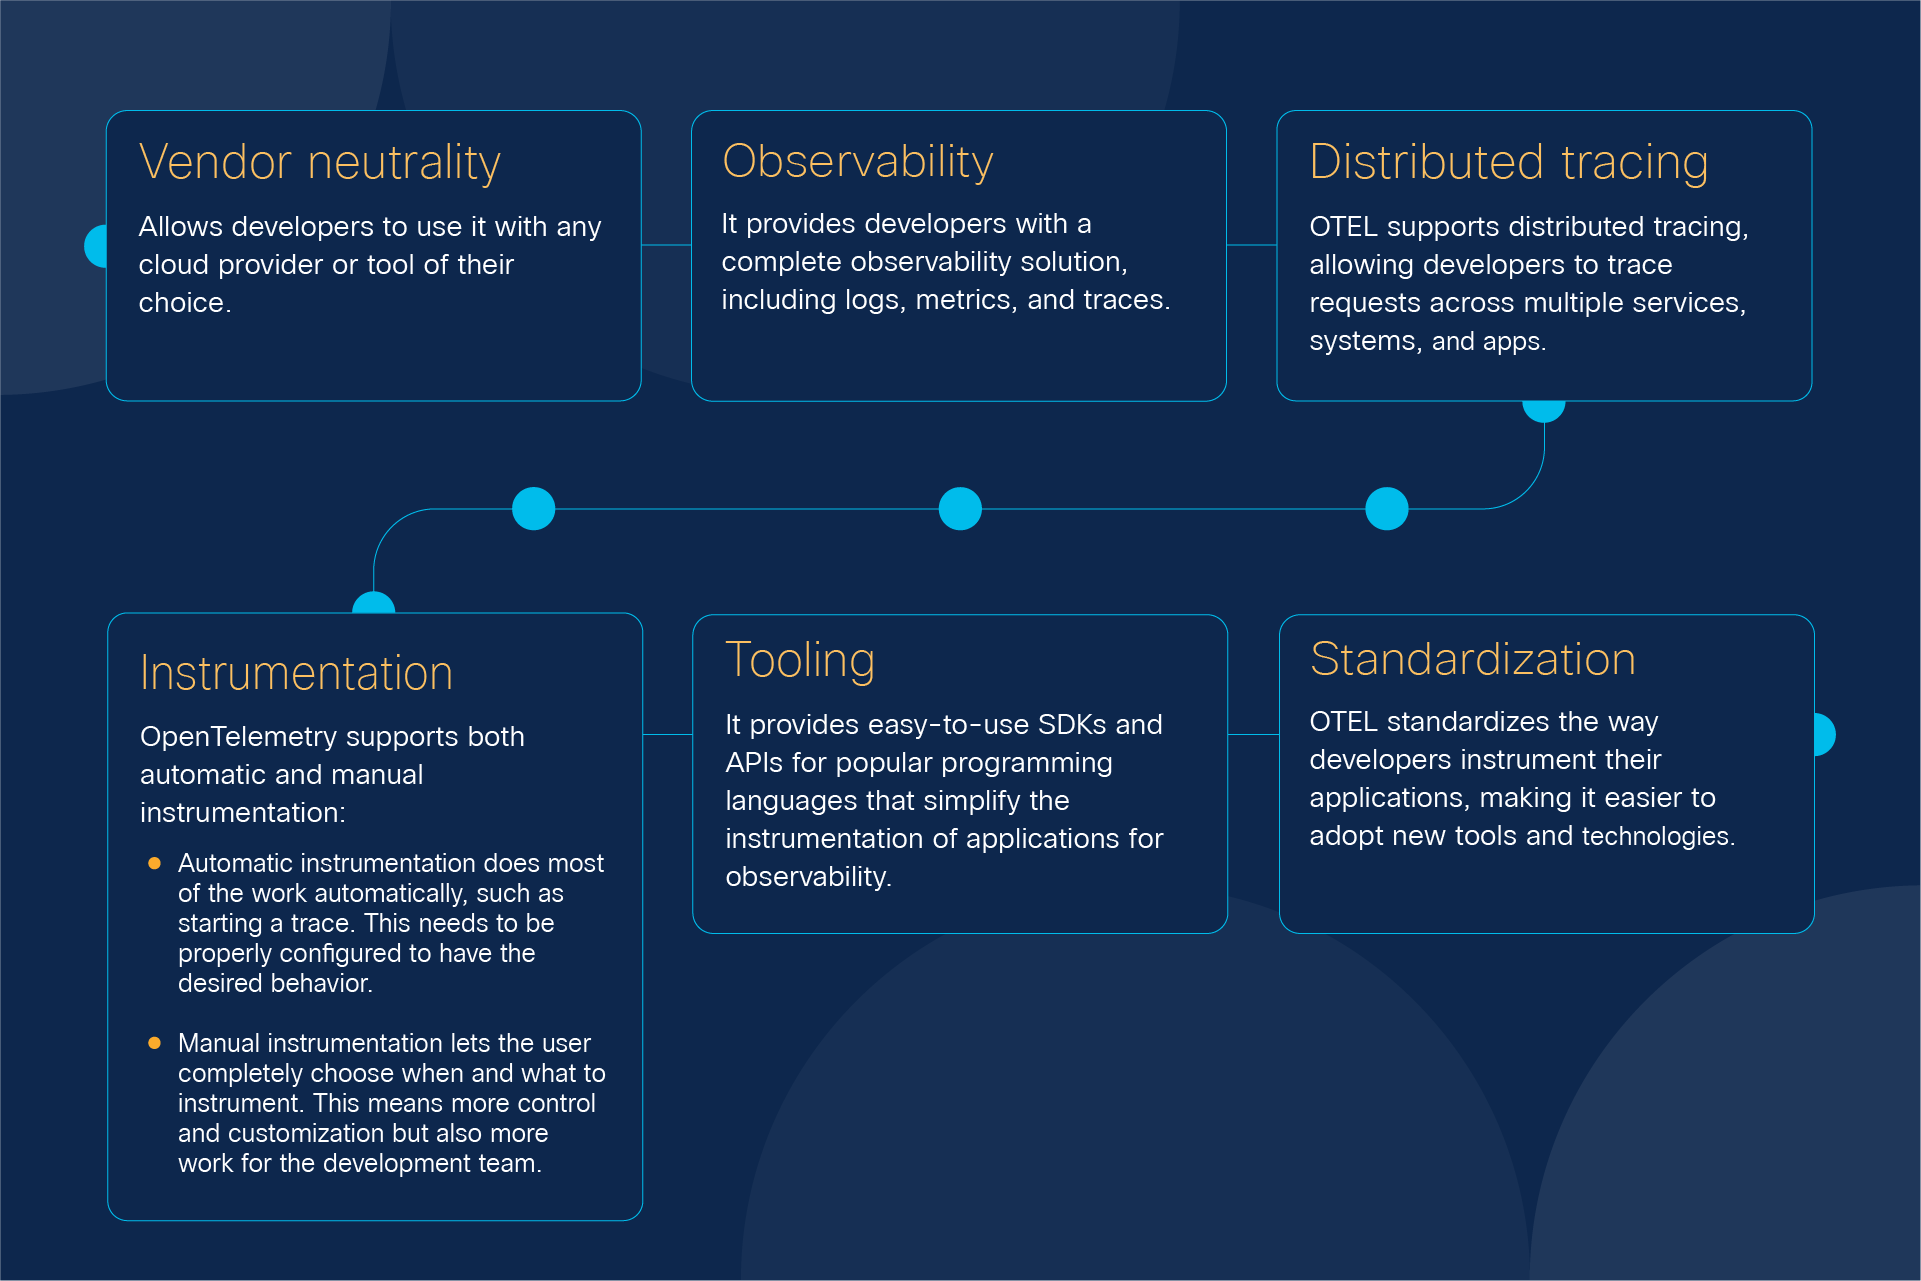
Vendor neutrality: OTEL is designed to be vendor-neutral, allowing developers to use it with any cloud provider or tool of their choice.
Observability: It provides developers with a complete observability solution, including logs, metrics, and traces.
Distributed tracing: OTEL supports distributed tracing, allowing developers to trace requests across multiple services, systems, and apps.
Instrumentation: OpenTelemetry supports both automatic and manual instrumentation:
Automatic instrumentation does most of the work automatically, such as starting a trace. This needs to be properly configured to have the desired behavior.
Manual instrumentation lets the user completely choose when and what to instrument. This means more control and customization but also more work for the development team.
Tooling: It provides easy-to-use SDKs and APIs for popular programming languages that simplify the instrumentation of applications for observability.
Standardization: OTEL standardizes the way developers instrument their applications, making it easier to adopt new tools and technologies.
Usage in the Industry
OTEL is widely used in the industry by companies of all sizes. It is particularly popular among cloud-native organizations that are looking for a standardized way to instrument their applications for the purpose of observability.
Some examples of successful projects that use OTEL for observability include the immensely popular container orchestration platform Kubernetes and the popular serverless service AWS Lambda.
What does instrumenting with OTEL mean for integrations?
AppDynamics now supports code which was instrumented using OpenTelemetry. This is relevant to application developers use an open source approach to instrument code. Ultimately, applications developers can instrument code with OpenTelemetry, then send telemetry data to Cisco AppDynamics. By supporting the open standard, AppDynamics provides developers with investment protection should they produce their data with OpenTelemetry then change vendors in the future.
As cloud-native grows, so will OTEL
OpenTelemetry gives developers an open-source framework to instrument their applications and microservices. It also lets them then export any collected data in a vendor-neutral and standardized manner to ensure a high level of compatibility with third-party apps.
OTEL’s vendor neutrality, observability features, and standardized instrumentation make it a popular choice among cloud-native organizations.
As the adoption of cloud-native technologies continues to grow, we can expect to see even more widespread adoption of OTEL in the future.
Resources
Blog: Future-proofing Observability with OpenTelemetry
Learning Lab: AppDynamics Cloud, which supports OpenTelemetry
Site: What is Observability?
Site: Cisco Developer Full-Stack Observability Hub