A DevOps Guide to Root Cause Analysis in Application Monitoring
Optimizing your root cause analysis process can transform a reactive team into a proactive, strategic DevOps team
Estimated time to read: 10 minutes
In the ever-evolving world of software development, the concept of full-stack observability has quickly become a cornerstone for ensuring robust application performance and reliability. This extensive approach is vital for practical root cause analysis in application monitoring, where the goal is not to just discover symptoms but to also uncover the underlying issues causing system disruptions or performance degradation.
This article aims to empower DevOps professionals with actionable insights and practical strategies for conducting effective root cause analysis. We'll explore the tools, techniques, and best practices to transform your root cause analysis process from a reactive firefighting exercise into a proactive, strategic game changer.
Setting the stage for effective root cause analysis
In the complex world of application monitoring, root cause analysis is the key to identifying and addressing underlying issues in system performance and functionality. Let’s discuss the basics of root cause analysis.
What does "root cause" signify in application monitoring?
When it comes to applications, identifying the "root cause" means pinpointing the exact source of a problem impacting a system's performance or functionality. It's about digging deeper to uncover why and how the problem arose.
Take an application with a slow response time. The root cause could be inefficient code, database query bottlenecks, or inadequate server resources. To properly resolve the underlying problem and avoid recurrence, you need to make sure you uncover the right one.
The importance of clear objectives for root cause analysis
Setting clear objectives for root cause analysis is crucial. Developers need to understand the patterns and trends that lead to problems, thereby preventing future occurrences.
For example, your objective might be to reduce the mean time to detect (MTTD) and repair (MTTR) of incidents. Such precise goals allow you to tailor your root cause analysis process to focus on these metrics, ensuring a more efficient and effective approach.
Overview of the landscape: full-stack observability platforms
Full-stack observability platforms offer insights into every application stack layer, making them valuable for effective root cause analysis. Tools like Cisco AppDynamics, Cisco ThousandEyes, and the Cisco Observability Platform help monitor applications across various environments:
- Cisco AppDynamics offers a unified view of application performance, covering aspects from user experience to server health; it enables quick identification of issues across your application stack.
- Cisco ThousandEyes specializes in monitoring applications across different environments, providing detailed insights for effective root cause analysis.
- Cisco Observability Platform is an API-driven platform focused on using OpenTelemetry and MELT data, as well as AI/ML-driven analytics to deliver impactful business insights.
Finding the right tools for application monitoring
Having the right tools for application monitoring is crucial for maintaining performance, security, and efficiency. This section will dive into various tools and techniques. Additionally, we’ll explore Cisco's AppDynamics for granular insight into application performance.
Plus, we’ll discuss how integrating tools like Cisco Intersight Workload Optimizer can enhance resource optimization, complemented by solutions from AWS and Google for a comprehensive monitoring strategy.
Tools with specific focus areas
In today's digital landscape, specialized solutions are vital for enhancing and monitoring various aspects of IT systems. These tools, categorized into specific focus areas, are tailored to meet a range of diverse needs.
Performance monitoring
Real-time insights are essential for pinpointing performance bottlenecks. For instance, using Cisco AppDynamics, you can monitor key performance indicators including response times, memory usage, error rates, CPU load, and throughput; this provides a comprehensive view of application health and efficiency.
Log analysis
Systems that analyze log data uncover hidden patterns, errors, and potential threats. They allow you to aggregate logs from various sources and use powerful search capabilities to uncover issues.
Tracing
This technique tracks individual transactions or workflows through various application components. Distributed tracing tools, like Zipkin and Jaeger, can be instrumental in understanding the flow of requests through microservices architectures.
Cisco AppDynamics for Granular Insight
Cisco AppDynamics offers deep visibility into application performance, allowing teams to monitor, correlate, and analyze data across the entire stack in real time.
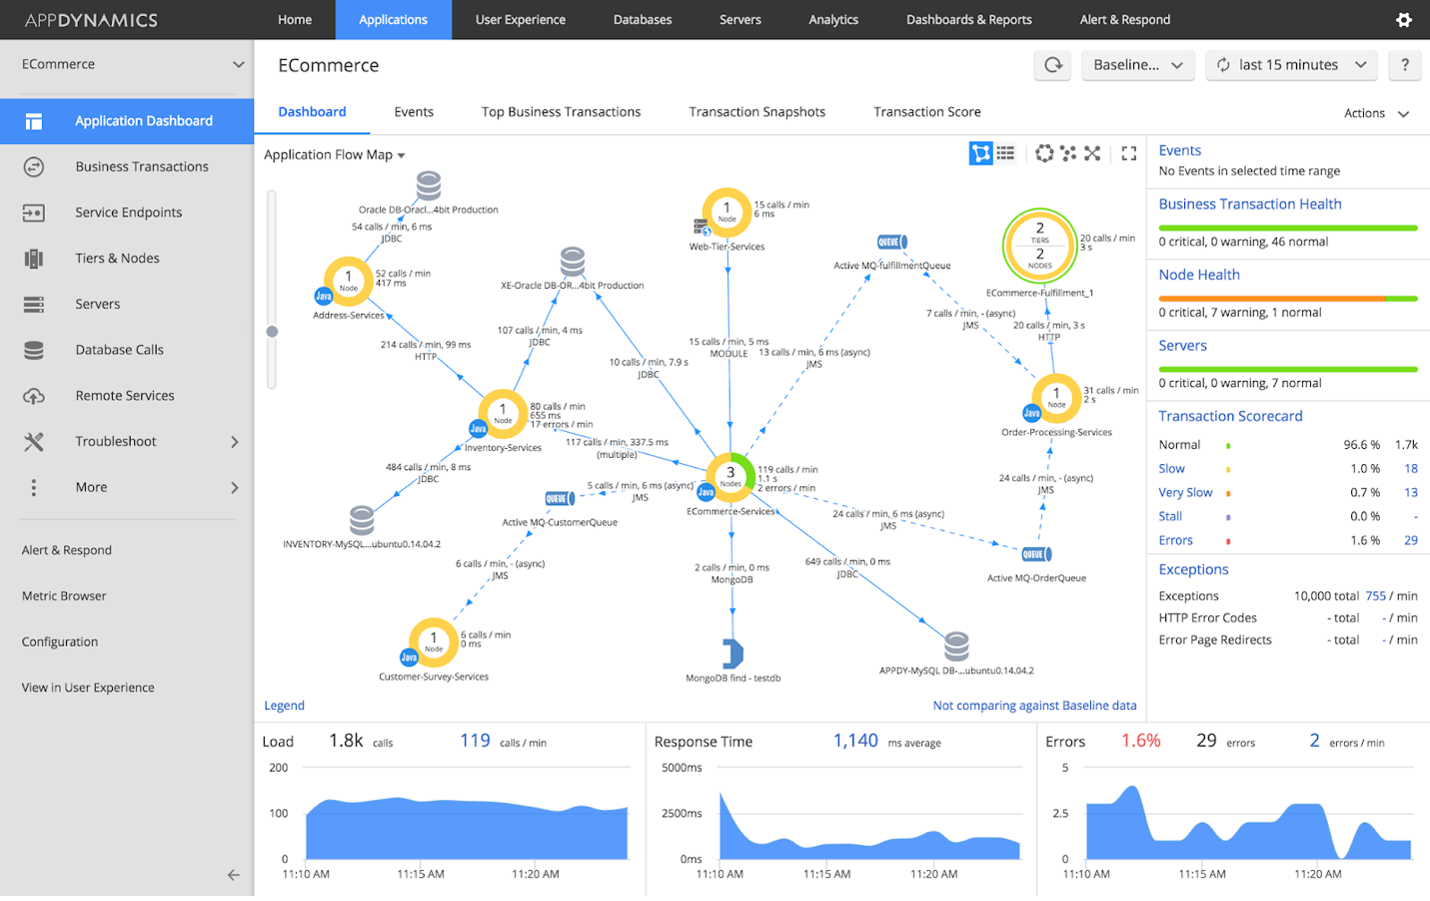
Figure 1: Cisco AppDynamics profiler (Source: Cisco)
For example, you can use its business transactions feature to track specific user journeys and identify where performance issues occur. Enhancing this capability, Cisco's Intersight Workload Optimizer integrates seamlessly with Cisco AppDynamics to optimize resource allocation, providing insights into resource utilization and recommending adjustments to prevent bottlenecks; these guarantee applications have the necessary resources to perform at their best.
In addition to Cisco's suite, AWS and Google offer their own monitoring solutions that can complement Cisco's offerings, providing a more comprehensive toolset for DevOps teams.
Understanding how application performance affects root cause
Understanding application dependencies and performance bottlenecks is a critical aspect of root cause analysis. Let's investigate how to map these dependencies and effectively identify bottlenecks using various tools.
Mapping application dependencies
Application dependencies can be complex, especially in microservices architectures. Solutions like Cisco AppDynamics can automatically discover and map out the connections between the application stack, databases, and the underlying infrastructure.
For example, Cisco AppDynamics' flow maps visually represent the interactions between different components, helping you spot performance hotspots:
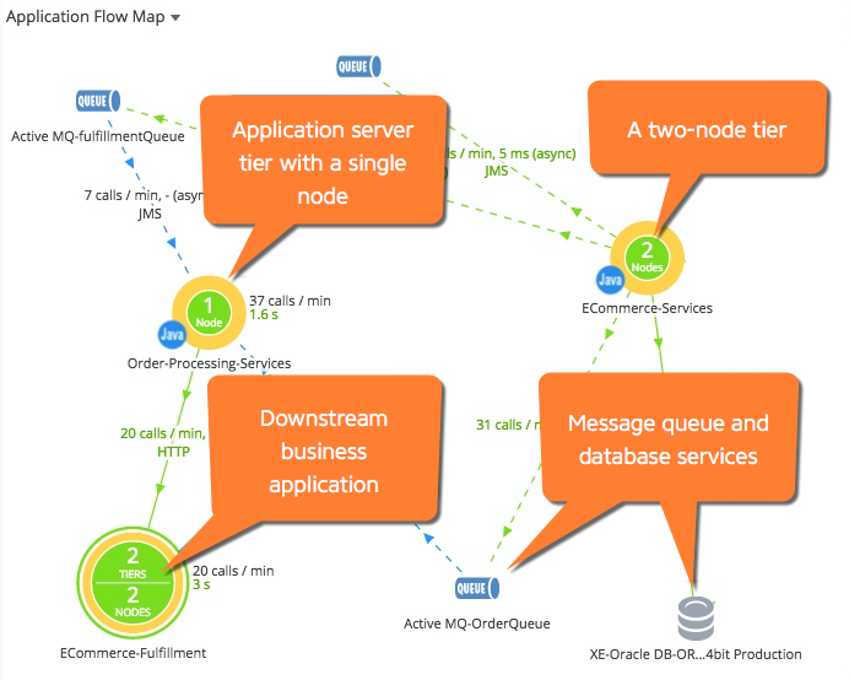
Figure 2: AppDynamics flow map (Source: Cisco)
Identifying performance bottlenecks
With your dependency map in hand, you can then pinpoint performance bottlenecks. This involves analyzing metrics like response times, CPU and memory usage, and database query performance.
For instance, a sudden spike in database response time might indicate a bottleneck. Using Application Monitoring (APM) tools, you can drill down into the slow database queries and identify whether the issue is due to poorly optimized queries, indexing issues, or resource constraints.
![]()
Figure 3: AppDynamics request performance tracking (Source: Cisco)
Utilizing advanced features
Many APM tools offer advanced features like dynamic baselining, which automatically sets performance baselines based on historical data. This feature helps you quickly identify deviations from the norm. Additionally, transaction snapshots give you a detailed record of slow transactions, allowing you to see the exact method calls and database queries that are causing issues.
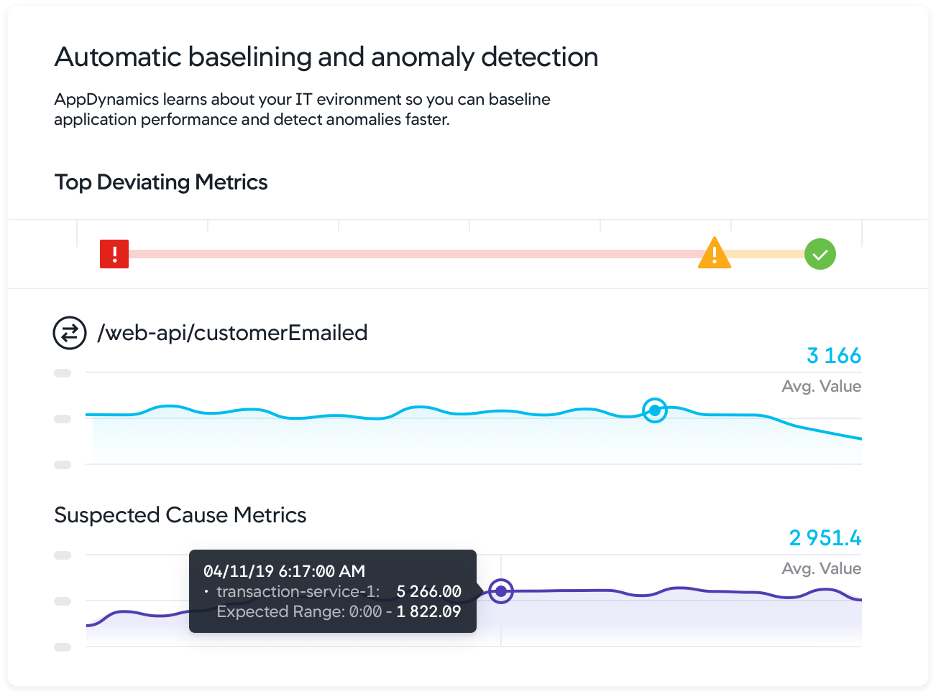
Figure 4: AppDynamics anomaly detection (Source: Cisco)
Log analysis for root cause
Log analysis is a critical component of root cause analysis. It enables a deeper understanding of an applications' or systems' internal mechanisms. Grasping the context around log entries — like correlating logs with performance metrics and traces — is crucial. This context provides a complete picture of what was happening at the time an issue arose.
For instance, if you see a series of error logs at the same time as a spike in response time, this correlation can provide valuable clues for root cause analysis.
AI/ML in root cause analysis
Artificial Intelligence and Machine Learning (AI/ML) technologies are transforming root cause analysis by enabling predictive analysis and anomaly detection.
Predictive analysis
Machine learning algorithms can use past performance data to predict where future problems may arise. For example, an AI model might predict a potential spike in load based on historical trends and alert you in advance, allowing you to take proactive measures.
Anomaly detection
AI/ML algorithms excel at detecting anomalies that might indicate issues. With their ability to handle large data volumes, they can uncover patterns that may not be readily obvious to human analysis. For instance, an ML model might detect an unusual pattern in application logs that precedes a system crash, enabling early intervention.
Best practices to kickstart your root cause analysis journey
Implementing best practices is a must for a successful root cause analysis process. Here, we'll explore actionable items to illustrate these practices:
Systematic approach
Adopting structured methodologies, like the “5 Whys” or a fishbone diagram, helps systematically identify root causes.
For instance, consider an issue where an application's response time has degraded significantly. By applying the 5 Whys technique, you might discover the following:
- Why is the application slow? The database queries are taking longer than usual.
- Why are the database queries slow? There's a high number of concurrent queries.
- Why are there so many concurrent queries? A recent feature release changed how data is fetched.
- Why was this change not identified as a risk? The change was not adequately tested for performance impact.
- Why was the performance testing inadequate? There's a lack of automated performance testing in the CI/CD pipeline.
This systematic questioning ultimately leads to the root cause: the need for improved performance testing in the CI/CD process.
Maintaining visibility
Comprehensive visibility across all system components is crucial. Using a tool like the Cisco Observability Platform brings together data from application, networking, infrastructure, security, cloud, sustainability, and business sources.
Encouraging continuous learning
Making sure teams continuously learn and improve is critical. For instance, after resolving an incident, conducting a post-mortem and sharing the findings with the team can be invaluable. Documenting these learnings in a shared repository or developer portal ensures the knowledge is accessible for future reference.
Collaboration and communication
Effective root cause analysis often requires collaboration across different teams. Collaboration tools like Cisco Webex can facilitate their communication. For example, setting up dedicated channels for incident response and root cause analysis discussions can help keep everyone on the same page.
The root cause analysis journey ahead
As we look to the future, the role of root cause analysis in DevOps is set to become even more critical. With the increasing complexity of software systems and the rapid pace of technological change, quickly and accurately identifying root causes is essential for maintaining high-performing, reliable applications.
In this journey, we expect to see further advancements in AI/ML technologies, providing even more sophisticated tools for predictive analysis and anomaly detection. The integration of these technologies into RCA processes will not only speed up issue resolution but also move organizations toward more proactive and predictive approaches to system reliability.
Moreover, as DevOps continues to evolve, there will be a greater emphasis on collaboration and knowledge sharing. This will lead to the formation of communities dedicated to root cause analysis, thereby promoting learning and progress.
Mastering root cause analysis is a journey of continuous adaptation and learning. By embracing the tools, strategies, and best practices outlined in this guide, DevOps practitioners can stay ahead of the curve, ensuring their applications are not only robust and reliable but also ready for the challenges of tomorrow's tech landscape.
Remember, the path to mastering root cause analysis is an ongoing process, and staying informed and adaptable is crucial to success in the dynamic world of DevOps and application monitoring.
Resources
Topic Hub: Full-Stack Observability Topic Hub
Documentation: Cloud Observability Connections API documentation
Learning Labs: Application Monitoring Learning Labs
API Tutorial: Anomaly Detection with Cisco Cloud Observability
Sample Code: Use anomaly detection to monitor entity health with Cisco Cloud Observability
API Doc: Cisco Observability Platform Anomaly Detection Configuration API