Mastering Observability in Kubernetes Production Environments: Part I — Monitoring
Kubernetes is the de facto platform for container orchestration, and enables developers to simply manage, deploy, and scale their cloud-native applications using container technologies. However, as applications grow and become more complex, developers have to monitor Kubernetes clusters to ensure optimal performance and achieve observability.
Monitoring lets a developer guarantee system stability, detect performance bottlenecks, and proactively identify and resolve issues, delivering a seamless user experience and maintaining the overall health of applications.
To help you achieve complete observability in Kubernetes production environments, we’ve crafted a three-part series. This series will explore the basics of monitoring, including best practices for monitoring in high-scale production environments.
Monitoring basics in Kubernetes
Before diving into the different observability solutions available for Kubernetes, it is essential to understand the key components that make up a Kubernetes cluster and the performance indicators that can provide valuable insights into your application's health.
Nodes
Your application's containers are run by nodes. Monitoring these physical or virtual machines helps you ensure they are operating efficiently and have adequate application resources.
Pods
The smallest unit that performs executions in a Kubernetes architecture is called a pod. One or more containers are found within each pod. Monitoring pods allows you to track the status, resource usage, and availability of your applications.
Deployments
Deployments offer a higher-level abstraction over pods by stating a number of replicas and an update strategy. Monitoring deployments enables you to ensure that your application is running with the desired configuration and can quickly recover from failures.
Services
The relationship between all the above components is summarized in the image below:
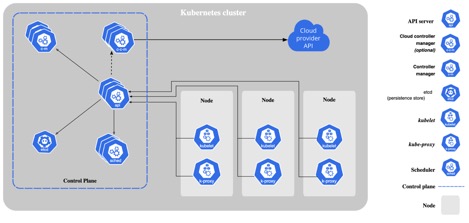
Figure 1: Kubernetes architecture overview (Source: Kubernetes Docs
Key Performance Indicators (KPIs) for Kubernetes clusters help understand network performance, consumption, and any issues. KPIs for Kubernetes are listed in the following table:
| KPI | Importance |
|---|---|
| CPU and memory usage | Understand resource consumption and identify bottlenecks |
| Network latency and throughput | Assess network performance between nodes, pods, and services |
| Pod and container states | Detect issues and maintain high availability |
Best practices for monitoring in high-scale production environments
By implementing the following best practices and setting up an effective monitoring solution, you can efficiently manage and observe your Kubernetes applications in high-scale production environments.
Fine-tune alert thresholds
Avoid false positives and alert fatigue by carefully setting thresholds for your alerts. Regularly review and adjust these thresholds based on historical data and changing requirements.
Implement autoscaling
Leverage Kubernetes' horizontal and vertical autoscaling features to automatically adjust the number of replicas or resources based on metrics like CPU and memory usage, ensuring optimal performance and efficient resource utilization.
Monitor custom application metrics
In addition to monitoring the built-in Kubernetes metrics, you may want to track custom metrics specific to your application's business logic. This can offer a significant understanding of user experience and assist in pinpointing potential problems that might not be detected through standard measurements.
Use alerts for incidents
Establish a robust incident management process to handle alerts at scale. Integrate monitoring tools with incident management platforms to streamline alerts, escalations, and on-call rotations.
Monitoring maximizes the performance of Kubernetes
Monitoring is crucial to ensuring the health and performance of your Kubernetes applications. By implementing an effective monitoring solution tailored to the needs of your Kubernetes applications in production, you can proactively identify and resolve issues, minimize downtime, and maintain a seamless user experience.
As you refine your observability practices, you will gain valuable insights into your application's performance, enabling you to make data-driven decisions and optimize your infrastructure.
Stay tuned for Part II of this series, where we will discuss the importance of logging, explore various logging solutions, and share best practices for managing logs in Kubernetes production environments.