websphere-message-broker-extension
IBM-websphere-msg-broker-monitor
Use Case
The IBM Integration Bus, formerly known as the IBM WebSphere Message Broker Family, provides a variety of options for implementing a
universal integration foundation based on an enterprise service bus (ESB). Implementations help to enable connectivity and transformation
in heterogeneous IT environments for businesses of any size, in any industry and covering a range of platforms.
This extension extracts resource and message flow statistics. The list of metrics that it extracts can be found here:
https://www.ibm.com/support/knowledgecenter/SSMKHH_10.0.0/com.ibm.etools.mft.doc/bn43250_.htm
https://www.ibm.com/support/knowledgecenter/en/SSMKHH_10.0.0/com.ibm.etools.mft.doc/ac19020_.htm
Prerequisites
-
Before the extension is installed, the prerequisites mentioned here need to be met. Please do not proceed with the extension installation if the specified prerequisites are not met
-
Download and install Apache Maven which is configured with
Java 8to build the extension artifact from source. You can check the java version used in maven using commandmvn -vormvn --version. If your maven is using some other java version then please download java 8 for your platform and set JAVA_HOME parameter before starting maven. -
If this extension is configured for Client transport type (more on that later), please make sure the MQ's host and port is accessible.
-
If this extension is configured for Bindings transport type (more on that later), admin level credentials to the queue manager would be needed. If the hosting OS for IBM MQ is Windows, Windows user credentials will be needed.
Dependencies
This extension requires the IBM MQ JMS client classes. Refer to the IBM documentation for the specific jars.
For IBM MQ 8.0 and above, it depends on the following jars
com.ibm.mq.allclient.jar
com.ibm.mq.traceControl.jar
fscontext.jar
jms.jar
providerutil.jar
For previous versions,
com.ibm.mqjms.jar
jms.jar
This extension works for Windows, Unix as well as AIX.
Installation
- Clone the "websphere-message-broker-extension" repo using
git clone <repoUrl>command. - Copy the following jars in the
websphere-message-broker-extension/libfolder. (These jars are shipped with your Websphere message broker product itself)
- For IBM MQ 8.0 and above, it depends on the following jars
com.ibm.mq.allclient.jar
com.ibm.mq.traceControl.jar
fscontext.jar
jms.jar
providerutil.jar
- For previous versions,
com.ibm.mqjms.jar
jms.jar
For Unix environments, the required jars can be found in <IBM_MQ_INSTALL_DIR>/java/lib.
Make sure to uncomment the dependencies in pom.xml based on the dependencies you are adding in lib folder.
- Run
mvn clean install -Pmq8for MQ version 8.X (default) ormvn clean install -Pmq7.5for MQ version 7.5. - The WMBMonitor-<version>.zip should get built and found in the target directory.
- Unzip the contents of WMBMonitor-<version>.zip file and copy the directory to
<your-machine-agent-dir>/monitors. - Edit config.yml file and provide the required configuration (see Configuration section)
- Restart the Machine Agent.
Please place the extension in the "monitors" directory of your Machine Agent installation directory. Do not place the extension in the "extensions" directory of your Machine Agent installation directory.
(IBM doesn't recommend copying the IBM jar files into other file locations.
In fact, from MQ version 8.0 onwards, IBM restricts the jars that can be copied. See here)
If you are planning to use it in Bindings mode, please make sure that based on your OS, the right paths containing the IBM MQ and JMS jars are specified in the appd-message-broker-monitor.sh or appd-message-broker-monitor.bat.
If you are planning to use it in Client mode, please download the right version of IBM MQ Client on that remote server and obtain the above mentioned IBM jars from there and place it in the directory and just like above change the paths in the appd-message-broker-monitor.sh or appd-message-broker-monitor.bat files.
Configuration
There are two configurations needed:
A. WebSphere Message Broker
On the WebSphere Message Broker
To get resource statistics from the broker, first you will have to enable the resource statistics on WMB (WebSphere Message Broker).
There are two ways that you can enable statistics:
a. You can run "mqsichangeresourcestats" by running it in IBM Integration Console (in WMB 9.0) or IBM WMB Command Console (in previous versions).
A sample command can be
    mqsichangeresourcestats BrokerA -c active -e default

    where
    BrokerA -> the broker name
    default -> the execution group / integration server
Please follow the below documentation to get more familiar with the mqsichangeresourcestats and mqsichangeflowstats command.
https://www-01.ibm.com/support/knowledgecenter/SSMKHH_10.0.0/com.ibm.etools.mft.doc/bj43320_.htm
https://www.ibm.com/support/knowledgecenter/SSMKHH_10.0.0/com.ibm.etools.mft.doc/an28420_.htm
b. You can also enable resource statistics from IBM WebSphere MQ Explorer.
- Open IBM WebSphere MQ Explorer
- Click on Integration Node i.e. Broker Name.
- Right click on the execution group which you want statistics for and start resource statistics.
To get message flow statistics, you have to enable them for a particular application / message flow:
    mqsichangeflowstats BrokerA -e default -k application -f messageflow -s -o xml -c active

    where
    BrokerA -> the broker name
    default -> the execution group / integration server
    application -> the application name
    messageflow -> the name of the message flow
Once you have started the statistic collection, you can confirm it by viewing the statistics as follows
- Open IBM WebSphere MQ Explorer
- Click on Integration Node i.e. Broker Name.
- Right click on the execution group which you want statistics for and view resource statistics.
Alternatively you can verify that the collection of statistics is enabled using the Broker's Web Interface.
The resource metrics get published every 20 seconds to a topic. For the above command, the statistics will get published on this topic $SYS/Broker/BrokerA/ResourceStatistics/default.
Similarly, snapshot statistics for message flows get published every 20 seconds to the corresponding topic $SYS/Broker/+/StatisticsAccounting/SnapShot/application/messageflow.
For more details, please follow the IBM documentation:
http://www.ibm.com/support/knowledgecenter/SSMKHH_10.0.0/com.ibm.etools.mft.doc/aq20080_.htm
The extension subscribes to a particular topic in a queue manager's queue. Please confirm that you have all of the following in the IBM WebSphere MQ explorer:
- A Queue Manager.
- A TCP Listener on some port controlled/managed by Queue Manager.
This port will be the port which we will use to subscribe to the statistics from the extension.
If the queue manager and/or TCP listener is not present, please create them.
B. Appdynamics extension Config.yml
On the appdynamics extension
You can run this extension in Client or Bindings mode. In Bindings mode the extension needs to be installed on the same box as the MQ Server. In Client mode the extension
needs to be remote and should have the access to the MQ Server.
If you are planning to use it in Bindings mode, please make sure that
based on your OS, the IBM library path in the appd-message-broker-monitor.sh or appd-message-broker-monitor.bat exists and that IBM MQ jar files are available in that location.
For eg. if the IBM jar files exist in opt/mqm/java/lib directory, update the appd-message-broker-monitor.sh file as below. (Take a note of two places where you may have to edit the path in the script file)
#!/bin/bash

#Passing machine agent process id to java process.
../../jre/bin/java -cp "./*:../../machineagent.jar:/opt/mqm/java/lib/*" -Djava.library.path=/opt/mqm/java/lib64 -Dlog4j.configuration=file:./log4j.xml -Dextension.configuration=./monitors/WMBMonitor/config.yml com.appdynamics.extensions.wmb.WMBMonitor $PPID

exit $?
If you are planning to use it in Client mode, please download the right version of IBM MQ Client on that remote server and obtain the above mentioned IBM jars from there.
Configure the config.yml file in the WMBMonitor directory.
    #This will create the metrics in all the tiers,under this path
    #metricPrefix: "Custom Metrics|WMB"

    #This will create the metricUtils in a specific Tier/Component. Make sure to replace the
    #<COMPONENT_ID> with the appropriate one from your environment. To find the <COMPONENT_ID> in your environment
    #,please follow the screenshot here https://docs.appdynamics.com/display/PRO42/Build+a+Monitoring+Extension+Using+Java
    metricPrefix: "Server|Component:<COMPONENT_ID>|Custom Metrics|WMB"

    queueManagers:
      - host: "localhost"

        #TCP Listener port. Please make sure that the listener is started.
        port: 2414

        #Actual name of the queue manager.
        name: "QMgr1"

        #The transport type for the queue manager connection, the default is "Bindings".
        #For bindings type connection WMQ extension (i.e machine agent) need to be on the same machine on which WebsphereMQ server is running
        #for client type connection WMQ extension is remote to the WebsphereMQ server. For client type, Change it to "Client".
        transportType: "Bindings"

        #Channel name of the queue manager. Channel should be server-conn type. Make sure the channel is active. It is irrelevant for Bindings Mode
        #channelName: "SYSTEM.ADMIN.SVRCONN"

        #userId and password with admin level credentials. For Windows, please provide the administrator credentials. These fields are irrelevant for Bindings Mode
        #userID: ""
        #password: ""

        #SSL related properties. Please provide the path.
        #sslKeyRepository: ""

        #Cipher Suites. eg. "SSL_RSA_WITH_AES_128_CBC_SHA256"
        #cipherSuite: ""

        #Client Connection Name
        clientID: "AppDynamics Extension for Message Broker"

        #Resource Statistics Subscribers - https://www.ibm.com/support/knowledgecenter/en/SSMKHH_9.0.0/com.ibm.etools.mft.doc/bj43310_.htm
        #Please make sure to provide unique subscriber name for each statistic subscription.
        resourceStatisticsSubscribers:
          - topic: "$SYS/Broker/+/ResourceStatistics/#"
            subscriberName: "allResourceStatistics"

        #Flow Statistics Subscribers - https://www.ibm.com/support/knowledgecenter/en/SSMKHH_9.0.0/com.ibm.etools.mft.doc/aq20080_.htm
        #Please make sure to provide unique subscriber name for each statistic subscription.
        flowStatisticsSubscribers:
          - topic: "$SYS/Broker/+/StatisticsAccounting/SnapShot/#/#"
            subscriberName: "allFlowStatistics"


        #For resource and flowstatistics, all the fields listed in this section will be reported as metrics.
        #Remove fields you don't need to reduce the number of metricUtils.
        #Available fields:
        #https://www.ibm.com/support/knowledgecenter/SSMKHH_10.0.0/com.ibm.etools.mft.doc/bn43250_.htm
        metrics:
          resourceStatistics:
            - type: "JVM"
              identifiers: ["summary","Heap Memory","Non-Heap Memory","Garbage Collection - Copy","Garbage Collection - MarkSweepCompact"]
              include:
                - InitialMemoryInMB : "InitialMemoryInMB"  #The initial amount of memory that the JVM requests from the operating system for memory management during startup. Its value might be undefined.
                - UsedMemoryInMB : "UsedMemoryInMB" #The amount of memory that is currently in use.
                - CommittedMemoryInMB : "CommittedMemoryInMB" #The amount of memory that is allocated to the JVM by the operating system.
                - MaxMemoryInMB : "MaxMemoryInMB" #The maximum amount of memory that can be used for memory management. Its value might be undefined.
                - CumulativeNumberOfGCCollections : "CumulativeNumberOfGCCollections" #The total number of garbage collections that have occurred for this instance of the JVM. Its value might be undefined.

            - type: "JDBCConnectionPools"
              identifiers: ["summary"]
              include:
                - MaxSizeOfPool : "MaxSizeOfPool"  #The maximum size of the connection pool.
                - ActualSizeOfPool : "ActualSizeOfPool"   #A snapshot of the number of connections currently in the pool when the statistics were reported.
                - CumulativeRequests : "CumulativeRequests"  #A count of the number of requests received by the connection pool during this accounting period.
                - CumulativeDelayedRequests : "CumulativeDelayedRequests"  #The number of times a request for a connection could not be satisfied immediately, because the number of allocated connections reached the maximum pool size and no connections are currently available.
                - MaxDelayInMilliseconds : "MaxDelayInMilliseconds"  #The maximum time a caller waited for a connection to be allocated, in milliseconds.
                - CumulativeTimedOutRequests : "CumulativeTimedOutRequests"  #A count of the number of requests for connections that could not be satisfied within 15 seconds.

            - type: "JMS"
              identifiers: ["summary"]
              include:
                - NumberOfOpenJMSConnections : "NumberOfOpenJMSConnections" #The current number of open JMS connections.
                - NumberOfClosedJMSConnections : "NumberOfClosedJMSConnections"  #The total number of JMS connections that were closed since the last integration server restart.
                - NumberOfOpenJMSSessions : "NumberOfOpenJMSSessions"  #The current number of open JMS sessions.
                - NumberOfClosedJMSSessions : "NumberOfClosedJMSSessions"  #The total number of JMS sessions that were closed since the last integration server restart.
                - NumberOfMessagesReceived : "NumberOfMessagesReceived"  #The total number of messages received by JMSInput or JMSReceive nodes.
                - NumberOfMessagesSent : "NumberOfMessagesSent" #The total number of messages sent by JMSOutput nodes.
                - NumberOfMessagesBrowsed : "NumberOfMessagesBrowsed"  #The total number of messages browsed by JMSReceive nodes.
                - NumberOfJMSConnectionFailures : "NumberOfJMSConnectionFailures"  #The total number of attempted JMS connections that failed since the last integration server restarts.

            - type: "Sockets"
              identifiers: ["summary"]
              include:
                - TotalSockets : "TotalSockets"    #The number of outbound sockets that have been opened since the last integration server restart.
                - TotalMessages : "TotalMessages"  #The number of requests for a socket; for example, from a SOAPRequest node.
                - TotalDataSent_KB : "TotalDataSent_KB"  #The number of bytes sent, in kilobytes (KB).
                - TotalDataReceived_KB : "TotalDataReceived_KB"  #The number of bytes received, in kilobytes (KB).
                - SentMessageSize_10KB-100KB : "SentMessageSize_10KB-100KB" #The number of messages sent in each size range. For example, a message of 999 bytes is counted in SentMessageSize_0-1KB; a message of 1000 bytes is counted in SentMessageSize_1KB-10KB.

            - type: "TCPIPClientNodes"
              identifiers: ["summary"]
              include:
                - OpenConnections: "OpenConnections" #The current number of open connections
                - ClosedConnections: "ClosedConnections" #The total number of connections that were closed since the last integration server restart
                - MessagesReceived: "MessagesReceived" #The total number of messages received (by TCPIPClientInput or TCPIPClientReceive nodes)
                - MessagesSent : "MessagesSent" #The total number of messages sent (by TCPIPClientOutput nodes)
                - BytesSent : "BytesSent" #The total amount of data sent (by TCPIPClientOutput nodes), excluding SSL wrappers.
                - BytesReceived: "BytesReceived"  #The total amount of data received (by TCPIPClientInput or TCPIPClientReceive nodes),  excluding SSL wrappers.
                - FailedConnections : "FailedConnections"  #The total number of attempted connections that failed since the last integration server restarts.

            - type: "TCPIPServerNodes"
              identifiers: ["summary"]
              include:
                - OpenConnections: "OpenConnections" #The current number of open connections
                - ClosedConnections: "ClosedConnections" #The total number of connections that were closed since the last integration server restart
                - MessagesReceived: "MessagesReceived" #The total number of messages received (by TCPIPClientInput or TCPIPClientReceive nodes)
                - MessagesSent : "MessagesSent" #The total number of messages sent (by TCPIPClientOutput nodes)
                - BytesSent : "BytesSent" #The total amount of data sent (by TCPIPClientOutput nodes), excluding SSL wrappers.
                - BytesReceived: "BytesReceived"  #The total amount of data received (by TCPIPClientInput or TCPIPClientReceive nodes),  excluding SSL wrappers.
                - FailedConnections : "FailedConnections"  #The total number of attempted connections that failed since the last integration server restarts.

          flowStatistics:
            - type: "MessageFlow"
              identifiers: [""]
              include:
                - TotalElapsedTime : "TotalElapsedTime"  #Total elapsed time spent processing input messages (microseconds)
                - MaximumElapsedTime : "MaximumElapsedTime"  #Maximum elapsed time that is spent processing an input message (microseconds)
                - MinimumElapsedTime : "MinimumElapsedTime"  #Minimum elapsed time that is spent processing an input message (microseconds)
                - TotalCPUTime : "TotalCPUTime" #Total processor time spent processing input messages (microseconds)
                - MaximumCPUTime : "MaximumCPUTime" #Maximum processor time that is spent processing an input message (microseconds)
                - MinimumCPUTime : "MinimumCPUTime" #Minimum processor time that is spent processing an input message (microseconds)
                - CPUTimeWaitingForInputMessage : "CPUTimeWaitingForInputMessage" #Total processor time spent waiting for input messages (microseconds)
                - ElapsedTimeWaitingForInputMessage : "ElapsedTimeWaitingForInputMessage" #	Total elapsed time that is spent waiting for input messages (microseconds)
                - TotalInputMessages: "TotalInputMessages" #Total number of messages processed.TotalInputMessages records only those messages that are propagated from input node terminals.
                - TotalSizeOfInputMessages : "TotalSizeOfInputMessages"  #Total size of input messages (bytes)
                - MaximumSizeOfInputMessages : "MaximumSizeOfInputMessages"   #Maximum input message size (bytes)
                - MinimumSizeOfInputMessages : "MinimumSizeOfInputMessages" #Minimum message input size (bytes)
                - NumberOfThreadsInPool : "NumberOfThreadsInPool"  #Number of threads in pool
                - TimesMaximumNumberofThreadsReached : "TimesMaximumNumberofThreadsReached"  #Number of times the maximum number of threads is reached
                - TotalNumberOfMQErrors : "TotalNumberOfMQErrors"   #Number of MQGET errors (MQInput node) or web services errors (HTTPInput node). For example, a conversion error occurs when the message is got from the queue.
                - TotalNumberOfMessagesWithErrors : "TotalNumberOfMessagesWithErrors"       #Number of messages that contain errors
                - TotalNumberOfErrorsProcessingMessages : "TotalNumberOfErrorsProcessingMessages"   #Number of errors when processing a message
                - TotalNumberOfTimeOutsWaitingForRepliesToAggregateMessages : "TotalNumberOfTimeOutsWaitingForRepliesToAggregateMessages"  #Number of timeouts when processing a message (AggregateReply node only)
                - TotalNumberOfCommits : "TotalNumberOfCommits"  #Number of transaction commits
                - TotalNumberOfBackouts : "TotalNumberOfBackouts"     #Number of transaction backouts

            - type: "Threads"
              identifiers: ["ThreadStatistics"]
              include:
                - TotalNumberOfInputMessages : "TotalNumberOfInputMessages"  #Total number of messages that are processed by a thread
                - TotalElapsedTime: "TotalElapsedTime" #Total elapsed time spent processing input messages (microseconds)
                - TotalCPUTime : "TotalCPUTime" #Total processor time spent processing input messages (microseconds)
                - CPUTimeWaitingForInputMessage : "CPUTimeWaitingForInputMessage"  #Total processor time spent waiting for input messages (microseconds)
                - ElapsedTimeWaitingForInputMessage : "ElapsedTimeWaitingForInputMessage" #Total elapsed time that is spent waiting for input messages (microseconds)
                - TotalSizeOfInputMessages : "TotalSizeOfInputMessages"    #Total size of input messages (bytes)
                - MaximumSizeOfInputMessages : "MaximumSizeOfInputMessages"    #Maximum size of input messages (bytes)
                - MinimumSizeOfInputMessages : "MinimumSizeOfInputMessages"  #Minimum size of input messages (bytes)

            - type: "Nodes"
              identifiers: ["NodeStatistics"]
              include:
                - Number: "Number" #Number of node statistics subfolders in Nodes folder
                - TotalElapsedTime: "TotalElapsedTime"  #Total elapsed time spent processing input messages (microseconds)
                - MaximumElapsedTime : "MaximumElapsedTime"  #Maximum elapsed time spent processing input messages (microseconds)
                - MinimumElapsedTime : "MinimumElapsedTime"  #Minimum elapsed time spent processing input messages (microseconds)
                - TotalCPUTime : "TotalCPUTime"  #Total processor time spent processing input messages (microseconds)
                - MaximumCPUTime : "MaximumCPUTime"  #Maximum processor time spent processing input messages (microseconds)
                - MinimumCPUTime : "MinimumCPUTime"  #Minimum processor time spent processing input messages (microseconds)
                - CountOfInvocations : "CountOfInvocations"  #Total number of messages that are processed by this node
                - NumberOfInputTerminals: "NumberOfInputTerminals"    #Number of input terminals
                - NumberOfOutputTerminals : "NumberOfOutputTerminals"  #Number of output terminals

            - type: "Nodes"
              identifiers: ["NodeStatistics|TerminalStatistics"]
              include:
                - CountOfInvocations : "CountOfInvocations"  #Total number of messages that are processed by this node

        derivedMetrics:
          flowStatistics:
            - type: "MessageFlow"
              identifiers: [""]
              include:
                - AverageElapsedTime : "AverageElapsedTime"
                - AverageCPUTime: "AverageCPUTime"
                - AverageCPUTimeWaitingForInputMessage: "AverageCPUTimeWaitingForInputMessage"
                - AverageSizeOfInputMessages: "AverageSizeOfInputMessages"

            - type: "Threads"
              identifiers: ["ThreadStatistics"]
              include:
                - AverageElapsedTime: "AverageElapsedTime"
                - AverageCPUTime: "AverageCPUTime"
                - AverageCPUTimeWaitingForInputMessage: "AverageCPUTimeWaitingForInputMessage"
                - AverageElapsedTimeWaitingForInputMessage: "AverageElapsedTimeWaitingForInputMessage"
                - AverageSizeOfInputMessages: "AverageSizeOfInputMessages"

            - type: "Nodes"
              identifiers: ["NodeStatistics"]
              include:
                - AverageElapsedTime: "AverageElapsedTime"
                - AverageCPUTime: "AverageCPUTime"


    #Don't change this unless you are having more than 10 queue managers to monitor.
    numberOfThreads: 10

    #Don't change this.
    machineAgentWatchDog:
      #In seconds
      initialDelay: 0
      #Check the existence of MA process in 'period' seconds.
      period: 5
Yml Validation
Please copy all the contents of the config.yml file and go here . On reaching the website, paste the contents and press the “Validate YAML” button.
Metric Properties
You may see some metrics as an ever increasing counter. Sometimes that is helpful but most of the times you may just want to see the change
in that minute for a particular metric. We let you configure that in the config.yml for each metric.
for eg.
            - type: "TCPIPClientNodes"
              identifiers: ["summary"]
              include:
                - OpenConnections: "OpenConnections" #The current number of open connections
                - MessagesReceived: "MessagesReceived" #The total number of messages received (by TCPIPClientInput or TCPIPClientReceive nodes)
                  delta: true
                  metricType: "SUM SUM INDIVIDUAL"
                - MessagesSent : "MessagesSent" #The total number of messages sent (by TCPIPClientOutput nodes)
                  delta: true
                  metricType: "SUM SUM INDIVIDUAL"
                - BytesSent : "BytesSent" #The total amount of data sent (by TCPIPClientOutput nodes), excluding SSL wrappers.
                  delta: true
                  metricType: "SUM SUM INDIVIDUAL"
                - BytesReceived: "BytesReceived"  #The total amount of data received (by TCPIPClientInput or TCPIPClientReceive nodes),  excluding SSL wrappers.
                  delta: true
                  metricType: "SUM SUM INDIVIDUAL"
                - FailedConnections : "FailedConnections"  #The total number of attempted connections that failed since the last integration server restarts.
                  delta: true
                  metricType: "SUM SUM INDIVIDUAL"
In the above configuration, for MessagesReceived,MessagesSent,BytesSent,BytesReceived,FailedConnections, we have configured two properties delta
and metricType
delta - For each metric that has delta: true, the extension calculates a difference between the current and previous value and reports the difference.
Default value for delta: false
metricType - It let's you define the metric qualifiers for the particular metric.
The format is "(Aggregation Qualifier) (Time Roll Up Qualifier) (Cluster Roll Up Qualifier)". To know more about these qualifiers, please visit https://docs.appdynamics.com/display/PRO43/Build+a+Monitoring+Extension+Using+Java
In the above example, metricType: "SUM SUM INDIVIDUAL", means
Aggregation Qualifier = SUM
Time Roll Up Qualifier = SUM
Cluster Roll Up Qualifier = INDIVIDUAL.
Performance overhead
There may be a performance overhead on activating resource and flow stats in your IIB environment. Please check this link on what IBM has documented about the performance impact.
Support for AIX
This extension works on AIX if you point to <file os-type="linux">appd-message-broker-monitor.sh</file> in the monitor.xml and change the appd-message-broker-monitor.sh and process_checker.sh files to using korn shell.
Troubleshooting
-
Please follow the steps listed in this troubleshooting-document in order to troubleshoot your issue. These are a set of common issues that customers might have faced during the installation of the extension.
-
Verify Machine Agent Data: Please start the Machine Agent without the extension and make sure that it reports data. Verify that the machine agent status is UP and it is reporting Hardware Metrics.
-
MQ Version incompatibilities : In case of any jar incompatibility issue, the rule of thumb is to use the jars from MQ version 8.0.
-
Metric Limit: Please start the machine agent with the argument
-Dappdynamics.agent.maxMetrics=5000if there is a metric limit reached error in the logs. If you don't see the expected metrics, this could be the cause. -
Check Logs: There could be some obvious errors in the machine agent logs. Please take a look.
-
The config cannot be nullerror.
This usually happenes when on a windows machine in monitor.xml you give config.yaml file path with linux file path separator /. Use Windows file path separator ** e.g. monitors\MQMonitor\config.yaml. For Windows, please specify
the complete path -
Please confirm whether the resourcestats and flowstats were enabled for the queue manager and the listener port is up.
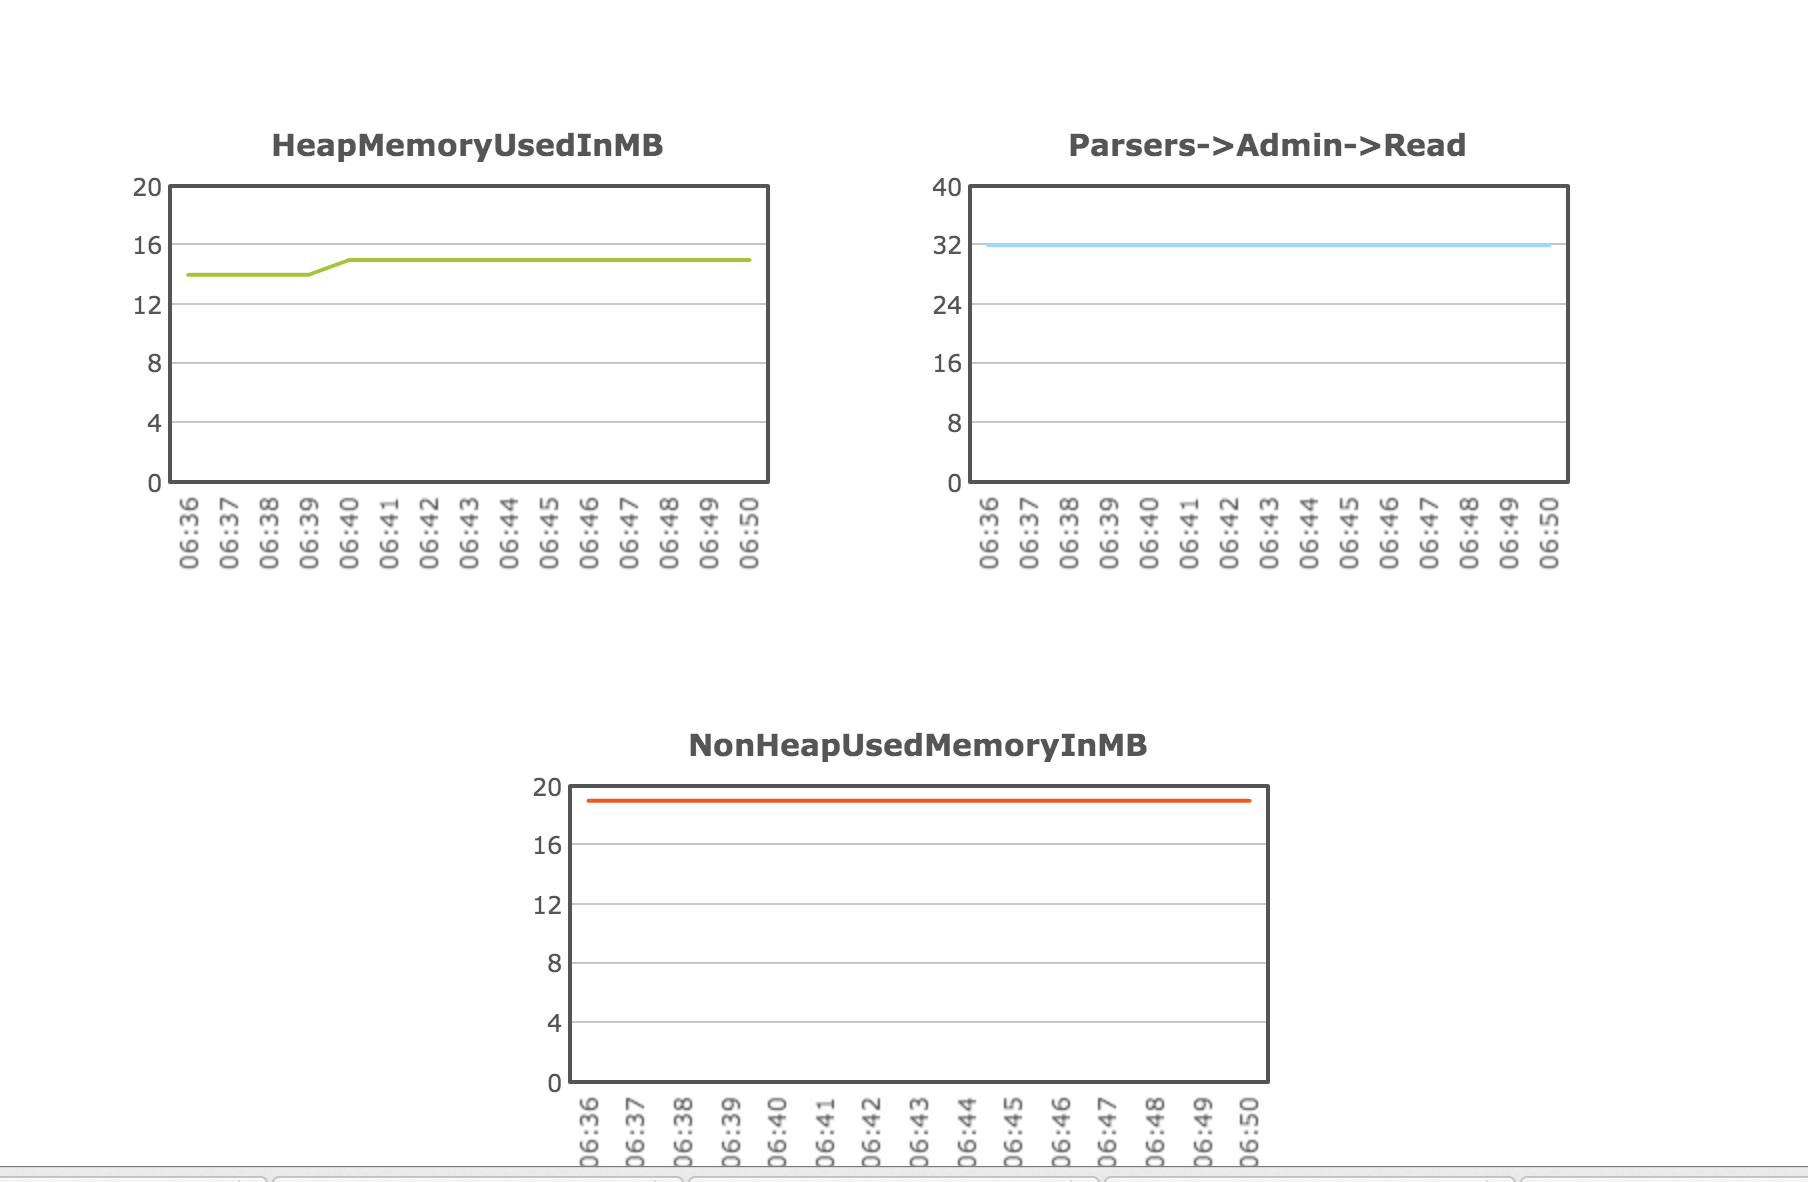
Custom Dashboard
Contributing
Always feel free to fork and contribute any changes directly via GitHub.
Version
| Name | Version |
|---|---|
| Extension Version | 6.0.1 |
| Product Tested on | 8.0.0.4 |
| Last Update | 01/12/2021 |
| Change List | ChangeLogs |
Note: While extensions are maintained and supported by customers under the open-source licensing model, they interact with agents and Controllers that are subject to AppDynamics’ maintenance and support policy. Some extensions have been tested with AppDynamics 4.5.13+ artifacts, but you are strongly recommended against using versions that are no longer supported.
Owner
Contributors
Github contributorsCategories
ObservabilityProducts
AppDynamicsProgramming Languages
JavaLicense
Apache License 2.0
Code Exchange Community
Get help, share code, and collaborate with other developers in the Code Exchange community.View CommunityCisco provides Code Exchange for convenience and informational purposes only, with no support of any kind. This page contains information and links from third-party websites that are governed by their own separate terms. Reference to a project or contributor on this page does not imply any affiliation with or endorsement by Cisco.