Troubleshooting Guide: Cisco Secure Access Add-On or App for Splunk
This guide provides answers to common questions about the Cisco Secure Access Add-On for Splunk or the Cisco Secure Access App for Splunk.
How to Access the Add-On and App Guides
- For information about the Cisco Secure Access Add-On for Splunk, see Cisco Secure Access Add-On for Splunk.
- For information about the Cisco Secure Access App for Splunk, see Cisco Secure AccessApp for Splunk.
Should I Restart Splunk After Installing the Add-On or App
- You do not have to restart your instance of Splunk after you update or configure the add-on.
- You must restart your instance of Splunk after you update or configure the app.
sc_admin Role and Viewing the Application Settings in the App
To view the Application Settings in the app and manage users, roles, indexes, and install applications, administrators must have the sc_admin role in the Splunk Cloud platform. For more information about role-based access controls (RBAC), see Role-Based Access Controls in the App.
Add the sc_admin Role
Add the sc_admin role for your user account in Splunk.
- In your instance of Splunk, navigate to the Inheritance tab.
- Navigate to the list of roles and then click the
sc_adminrole.
About Configuring the Data Inputs
In the add-on, configure data inputs for the Umbrella or Secure Access event types. Splunk manages the Umbrella or Secure Access event data and displays the events on the Cloud Security dashboards in the Cisco Secure Access App for Splunk.
Umbrella data inputs
Configure any of the available Umbrella event types: dns, firewall, proxy, audit, or dlp.
- DNS logs
- Firewall logs
- Proxy logs for the Secure Web Gateway (SWG)
- Audit logs
- Data Loss Prevention (DLP) logs
Samples of the Umbrella log endpoints in a Cisco-managed bucket
| Event Type | Example |
|---|---|
| dns | 2506xxx_2db1xxxx1ddf7cxxx18652xxxxfdab7xxxxd60xx/dnslogs/ |
| proxy | 2506xxx_2db1xxxx1ddf7cxxx18652xxxxfdab7xxxxd60xx/proxylogs/ |
| firewall | 2506xxx_2db1xxxx1ddf7cxxx18652xxxxfdab7xxxxd60xx/firewalllogs/ |
| audit | 2506xxx_2db1xxxx1ddf7cxxx18652xxxxfdab7xxxxd60xx/auditlogs/ |
| dlp | 2506xxx_2db1xxxx1ddf7cxxx18652xxxxfdab7xxxxd60xx/dlplogs/ |
Secure Access data inputs
You must configure all available Secure Access event types: dns, firewall, proxy, audit, dlp, ravpn, ztna, and ips.
- DNS logs
- Firewall logs
- Proxy logs for the Secure Web Gateway (SWG)
- Audit logs
- Data Loss Prevention (DLP) logs
- Remote Access Virtual Private Network (RAVPN) logs
- Zero Trust Network Access (ZTNA) logs
- Zero Trust Network Access (ZTNA) Flow logs
- Intrusion Prevention System (IPS) logs
Samples of the Secure Access log endpoints in a Cisco-managed bucket
| Event Type | Example |
|---|---|
| dns | 2506xxx_2db1xxxx1ddf7cxxx18652xxxxfdab7xxxxd60xx/dnslogs/ |
| proxy | 2506xxx_2db1xxxx1ddf7cxxx18652xxxxfdab7xxxxd60xx/proxylogs/ |
| firewall | 2506xxx_2db1xxxx1ddf7cxxx18652xxxxfdab7xxxxd60xx/firewalllogs/ |
| audit | 2506xxx_2db1xxxx1ddf7cxxx18652xxxxfdab7xxxxd60xx/auditlogs/ |
| dlp | 2506xxx_2db1xxxx1ddf7cxxx18652xxxxfdab7xxxxd60xx/dlplogs/ |
| ravpn | 2506xxx_2db1xxxx1ddf7cxxx18652xxxxfdab7xxxxd60xx/ravpnlogs/ |
| ztna | 2506xxx_2db1xxxx1ddf7cxxx18652xxxxfdab7xxxxd60xx/ztnalogs/ |
| ztna flow logs | 2506xxx_2db1xxxx1ddf7cxxx18652xxxxfdab7xxxxd60xx/ztnaflowlogs/ |
| ips | 2506xxx_2db1xxxx1ddf7cxxx18652xxxxfdab7xxxxd60xx/intrusionlogs/ |
How to List the Secure Access or Umbrella DNS Logs in My Cisco-Managed S3 Bucket
Open a shell in your environment.
Set the environment variables for your AWS S3 bucket.
- Set
AWS_ACCESS_KEY_IDto the value of your AWS S3 bucket key. - Set
AWS_SECRET_ACCESS_KEYto the value of your AWS S3 bucket secret.
export AWS_ACCESS_KEY_ID=YourKey export AWS_SECRET_ACCESS_KEY=YourSecret- Set
Run the AWS command-line interface (CLI) with the
s3 lscommand to list the Secure Access or Umbrella DNS logs.aws s3 ls s3://cisco-managed-us-east-2/{Yourprefix}/dnslogs –recursive
About Event Log Headers
We do not recommend enabling headers when you export the logs from the Cisco-managed or your own AWS S3 bucket. If you enable headers for event logs, Splunk displays the log headers with the event data. To filter out the log headers in the search results, you can add this where clause to the query:
| where NOT (Timestamp="Timestamp" OR Timestamp="Time")
How to Check the Version of Python Set Up with Your Splunk Instance
If you cannot view the Inputs page in the add-on, we recommend that you verify that your instance of Splunk is configured to run Python v3.9.x.
Note: The Cisco Secure Access Add-On for Splunk v1.0.39 or later requires Python version 3.9.
Open a shell in your environment.
Run the Splunk CLI to get the version of Python that is running with your instance of Splunk.
${SPLUNK_HOME}/splunk/bin/splunk cmd python -V
How to Create an Input with a Self-Managed S3 Bucket
Configure an input for your self-managed S3 bucket.
Navigate to Inputs, and then click Create New Input.
For Add Cisco Cloud Security Addon, enter a Name, Interval, Index, your AWS S3 bucket settings, Default Start Date, and Event Type.
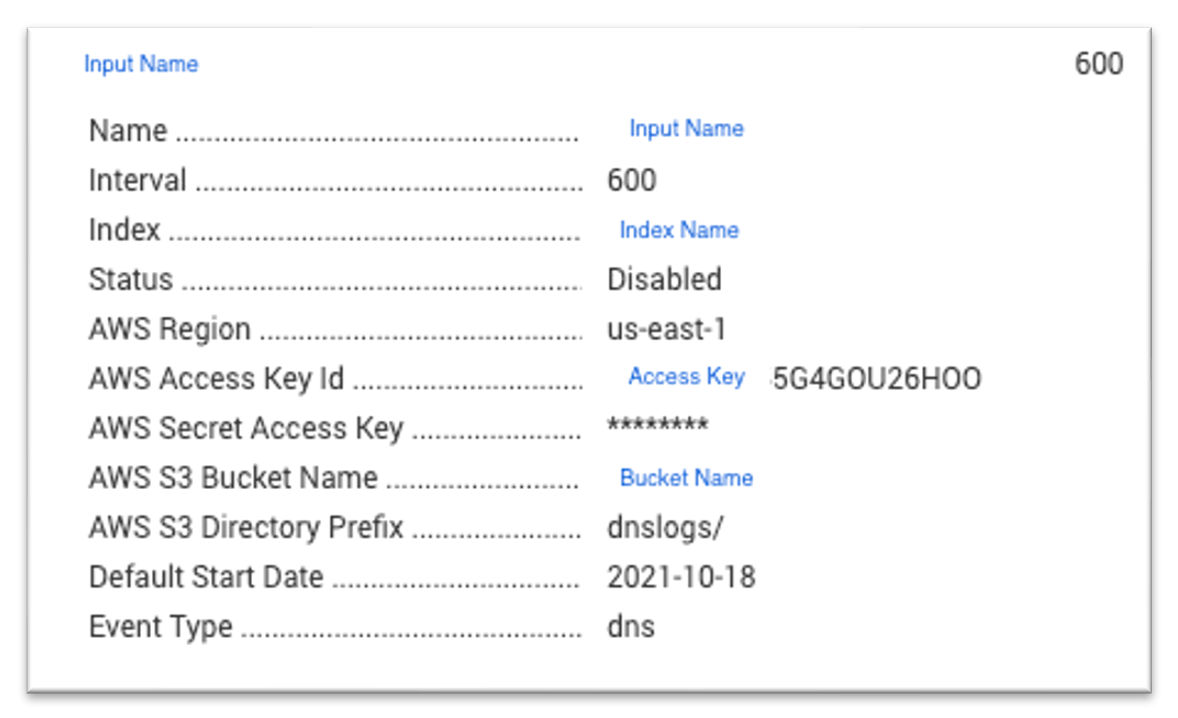
For information about configuring data inputs in the add-on for a Cisco-managed S3 bucket, see Cisco Secure Access Add-On for Splunk.
Location of Logs in Splunk Enterprise or Splunk Cloud
View the Splunk log and logs for the add-on and app in your instance of Splunk.
Splunk Enterprise
- Splunkd log:
${SPLUNK_HOME}/var/log/splunk/splunkd.log - Cisco Secure Access Add-On for Splunk:
${SPLUNK_HOME}/var/log/splunk/cisco_cloud_security_addon.log - Cisco Secure Access App for Splunk:
${SPLUNK_HOME}/var/log/splunk/ciscocloudsecurity.log
Splunk Cloud
- Splunkd log:
index="_internal" splunkd.log - Cisco Secure Access Add-On for Splunk:
index="_internal" sourcetype=cisco_cloud_security_addon.log - Cisco Secure Access App for Splunk:
index="_internal" ciscocloudsecurity.log
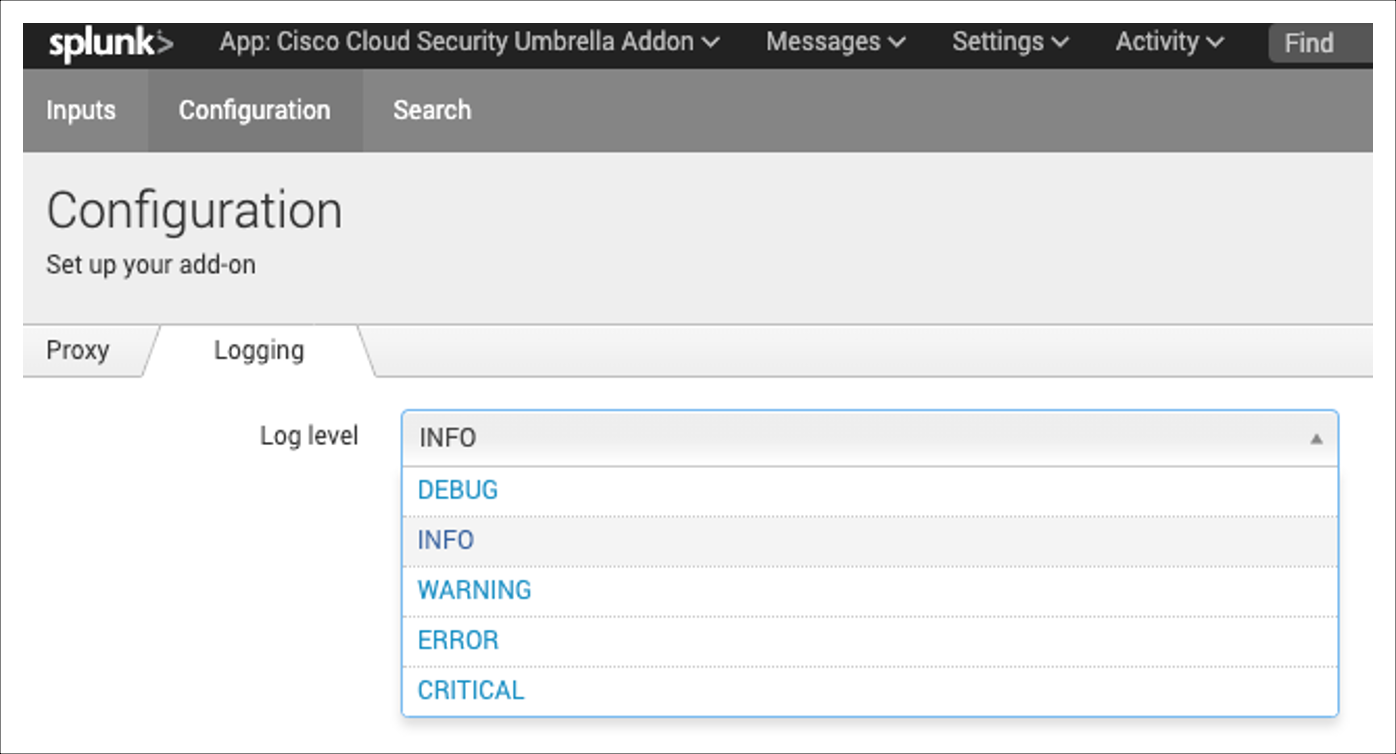
How to Increase the Logging Level in the Add-On
Sign in to your instance of Splunk, and then navigate to the add-on.
Navigate to Configuration, and then click on Logging.
For Log level, choose the logging level for the add-on.
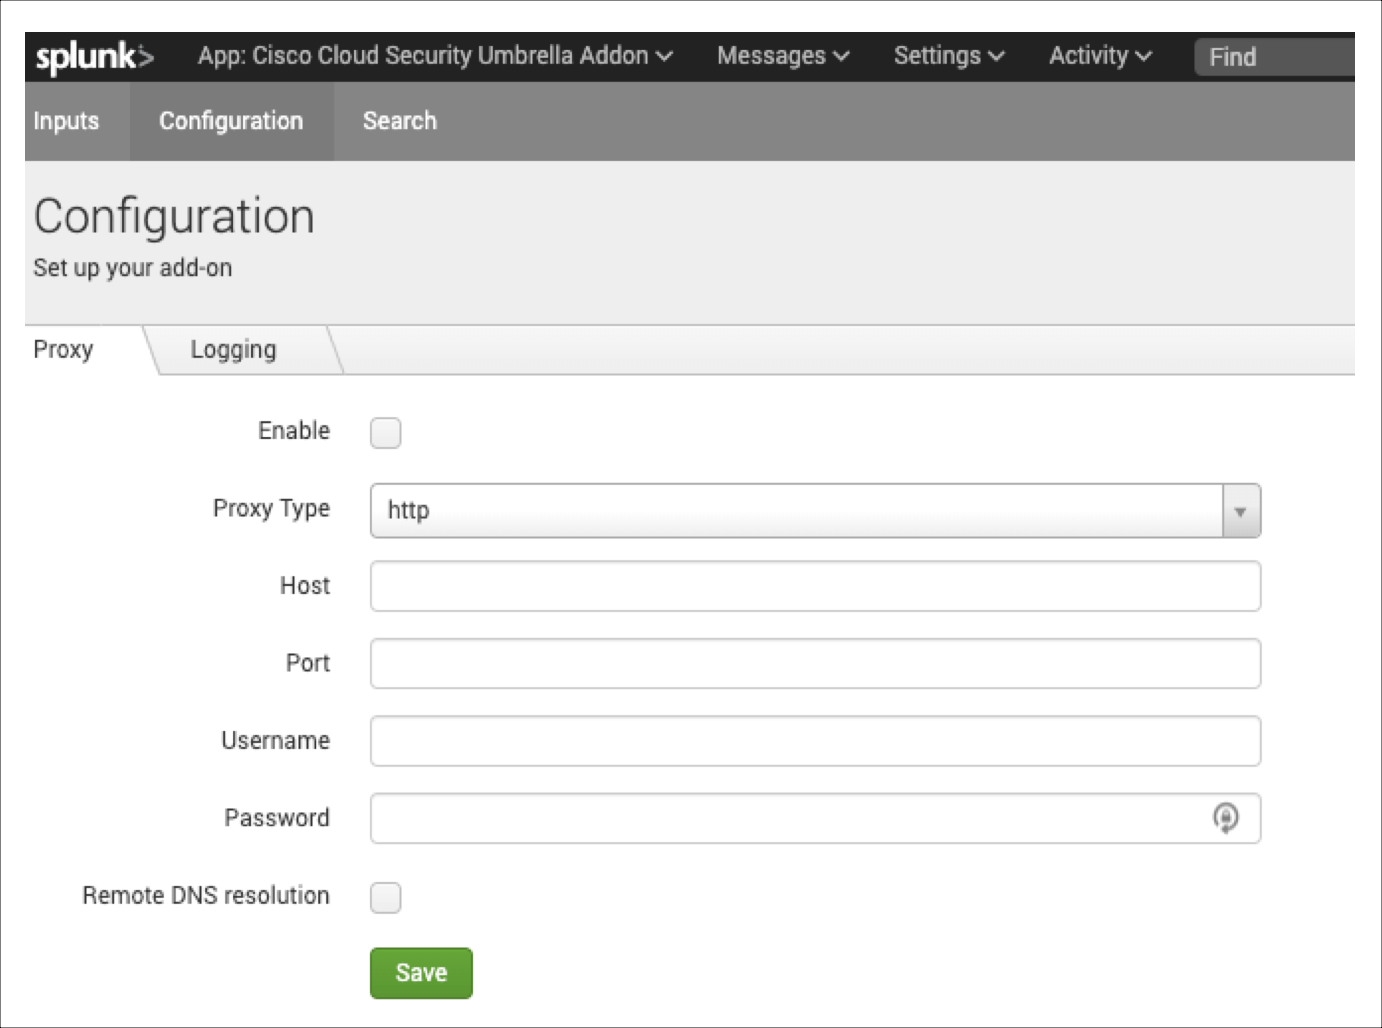
How to Configure a Proxy with the Add-On
You can configure a proxy in the add-on.
Sign in to your instance of Splunk, and then navigate to the add-on.
Navigate to Configuration, and then click on Proxy.
For Proxy Type, choose http, and the enter the value for Host, Port, Username, and Password.
Click Save.
How to View the Configured Settings in the App
Note: You cannot view the values of the configured API access tokens.
Sign in to your instance of Splunk, and then navigate to the app.
Navigate to Application Settings.
Click View History.

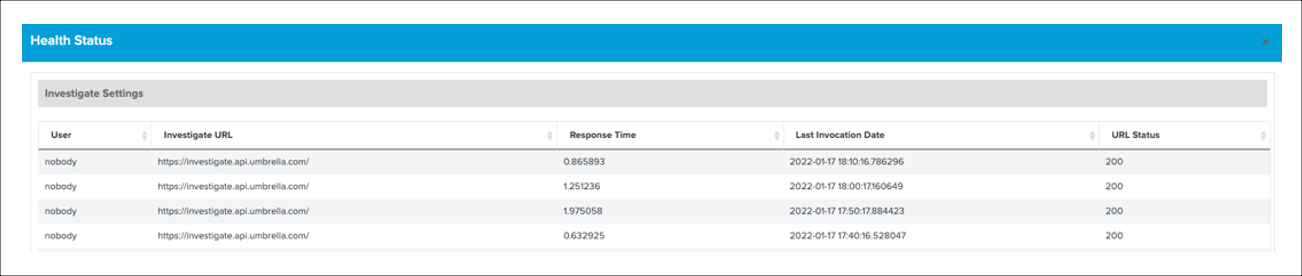
How to Check the Status of the APIs
Get the status of the Cisco Secure Access API or Cisco Umbrella API.
Sign in to your instance of Splunk, and then navigate to the app.
Navigate to Application Settings.
Click Show Health Status.

If the response code for the API requests is not 200, we recommend that you review the API credentials that you configured in the app.
Note: The default polling period or interval for the health checks is 10 minutes. You can configure the polling period in the app.
Location of the Add-On or App in a Splunk Enterprise Deployment
- Cisco Secure Access Add-on for Splunk:
${SPLUNK_HOME}/etc/apps/TA-cisco-cloud-security-addon - Cisco Secure Access App for Splunk:
${SPLUNK_HOME}/etc/apps/cisco-cloud-security