Cloud Security App For Splunk
The Cisco Cloud Security App integrates your Cloud Security data with event data from Splunk. Cisco Cloud Security includes Cisco Umbrella, Cisco Investigate, and Cisco Cloudlock. Splunk is a robust Security Information and Event Management (SIEM) platform. Splunk provides anomaly detection, incident forensics, and vulnerability management.
The Cloud Security App for Splunk guide explains how to install, deploy, and use the Cisco Cloud Security App for Splunk.
About the Cloud Security App
View your Cloud Security data, interact with the Cloud Security dashboards in Splunk, automate security for your networks, and contain threats.
- View and research domains, URLs, and IPs using Umbrella Investigate.
- Block and unblock destinations with the Umbrella Destination Lists API.
- Provide visibility into the application traffic on your organization's networks with the App Discovery API.
- View detailed Cloud Access Security Broker (CASB) incident information with the Cisco Cloudlock API.
- Show visualizations of aggregated Umbrella event data using the Cloud Security APIs.
The Cisco Cloud Security App for Splunk is available at,
https://classic.splunkbase.splunk.com/app/5558/
What's New
Updates to the Cisco Cloud Security App for Splunk.
Cisco Cloud Security App Version 1.0.39
- Added the App Discovery (CASB) dashboard.
- Updated the data included on the dashboards in the app.
- The app creates the dashboards seamlessly from your data using the Umbrella and Cloudlock APIs.
- The app extends the dashboards with granular data that is collected on Splunk.
- Updated the configuration of the Log Index Settings to include the
dlp(Data Loss Prevention) logs. - Updated alert actions: Investigate Destinations, Block Destinations, and Destination Reports. For more information, see Configure Alerts.
Prerequisites
- Splunk Enterprise, Splunk Cloud.
- Splunk platform versions: 9.2, 9.1, 9.0.
- Access to Cisco Umbrella, Cisco Investigate, and Cisco Cloudlock.
- Umbrella API key. For more information, see Authentication.
- Investigate API key. For more information, see Authentication.
- Cloudlock API token. For more information, see Cloudlock Authentication.
- Splunk administrative privileges.
Create an API Key With the Required Scopes
To get your data using the Umbrella APIs into the Cloud Security app on Splunk, you must create an API key with the required Umbrella OAuth 2.0 scopes.
- For the Umbrella dashboards, add the Reports > Aggregations (Read-only) key scope on the API key:
reports.aggregations:read
- For the Destination Lists API, add the Policies > Destination Lists (Read/Write) and Policies > Destinations (Read/Write) key scopes on the API key:
policies.destinationlists:writepolicies.destinations:write
- For the App Discovery API, add the Reports > App Discovery (Read/Write) key scope on the API key:
reports.appDiscovery:write
- For the Investigate API, add the Investigate > Investigate (Read-only) and Investigate > InvestigateBulk (Read-only) key scopes on the API key:
investigate.investigate:readinvestigate.bulk:read
For more information about the Umbrella API key scopes, see OAuth 2.0 Scopes.
Previous Releases
Information about previous Cisco Cloud Security App for Splunk software releases.
Cisco Cloud Security App Version 1.0.30
- Investigate module
- Added Investigate scheduled report.
- Added classification and categorization.
- Removed deprecated items.
- Splunk account—Map a request to a Splunk user account.
- Dashboard panels—Only show configured log sources.
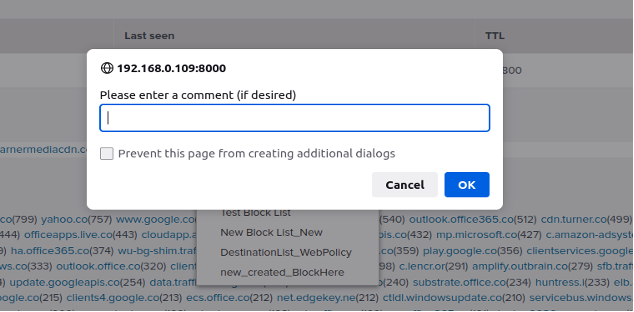
- Destination lists—Provided option to add a comment while blocking a destination.
- Fixed security vulnerabilities and upgraded library.
Prerequisites
- Splunk version 8.2.0 or later
- Access to Cisco Umbrella, Cisco Investigate, and Cisco Cloudlock
- Splunk administrative privileges
- Umbrella Management API key. For more information, see Legacy Umbrella Management Authentication.
- Investigate API token. For more information, see Umbrella Investigate Authentication.
- Cloudlock API token. For more information, see Cloudlock Authentication.
Install Cloud Security App
- Navigate to Splunkbase at
https://splunkbase.splunk.com/. - Search for Cisco Cloud Security.
- Download and install the Cisco Cloud Security App.
- Restart your Splunk instance to complete the installation of the app.
Install Cloud Security App in Distributed Deployments
You can install the Cloud Security App in a distributed deployment of Splunk Enterprise, or any deployment where you use forwarders to retrieve your data. Depending on your environment and preferences, and the requirements of the app, you can install the app in multiple environments.
We recommend that you install the Cisco Cloud Security App using the Splunk search heads and Splunk indexers.
| Splunk Platform Component | Support |
|---|---|
| Search Heads | Install and configure only the Destination Lists and S3 indexes. |
| Indexers | Install and configure only the Investigate and Cloudlock APIs and indexes. |
Role-Based Access Control
The Cisco Cloud Security App creates roles for use in the dashboard views and the Application Settings view.
| Role | Permissions |
|---|---|
| cs_admin |
|
| cs_supervisor |
|
| cs_user |
|
Upgrade Cloud Security App
Navigate to Splunkbase at
https://splunkbase.splunk.com/.Search for Cisco Cloud Security.
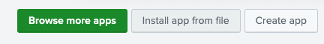
Navigate to Manage Apps.
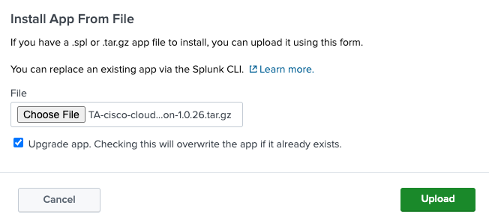
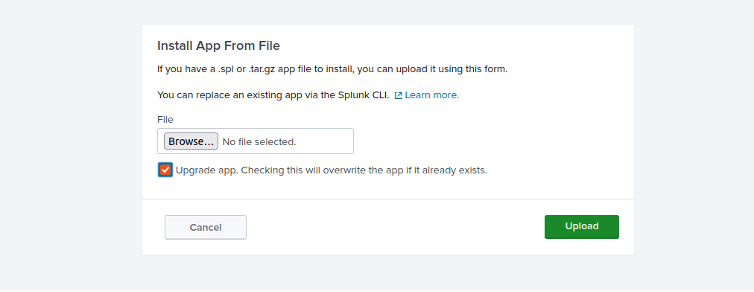
Click on Install app from file.
Check Upgrade app and choose the zipped tar file, then click Upload.
Accept the restart request. As part of the upgrade, Splunk restarts your Splunk instance.
About Cloud Security Apps Menu
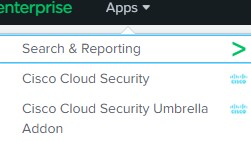
The Apps Menu displays a navigation bar that includes the Splunk Search and the Cloud Security App modules.
- Search
- Cloud Security
- Umbrella
- Investigate
- CASB (App Discovery)
- Cloudlock
- Application Settings

Configure Application Settings
- Configure your Dashboard settings.
- Configure the Umbrella API settings, including the Umbrella App Discovery settings.
- Configure Umbrella Investigate.
- Configure Cloudlock.
- Configure the Umbrella Destination Lists settings.
- Configure the Log Index settings—Choose the inputs on the app to search for event data in the Umbrella logs.
Dashboard Settings
Navigate to Dashboard Settings.
Choose a Default Search Interval and Panel Refresh Rate.
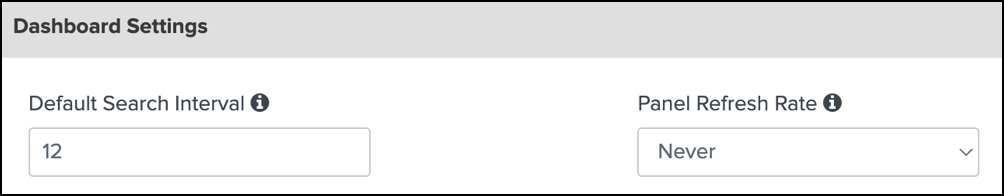
- For Default Search Interval, enter an integer. When first installed, the app sets the Default search interval to
1.- If you upgrade the app, you must configure the Default search interval to ensure that the calendar dates align with your instance of Splunk.
- If you update the Default Search Interval, we recommend that you clear your browser cache.
- For Panel Refresh Rate, choose how often the app refreshes your dashboard view.
- For Default Search Interval, enter an integer. When first installed, the app sets the Default search interval to
Umbrella API Settings
Navigate to Umbrella API Settings.
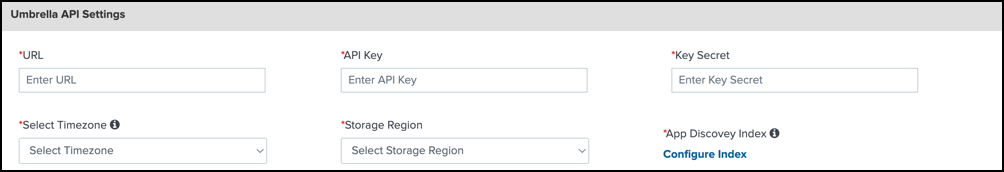
- For URL, enter the legacy Umbrella API URL:
https://api.umbrella.com. - For API Key, enter your Umbrella API key ID.
- For Key Secret, enter your Umbrella API key secret.
- For Select Timezone, choose the timezone where you are running the app.
- For Storage Region, choose the location of your storage region.
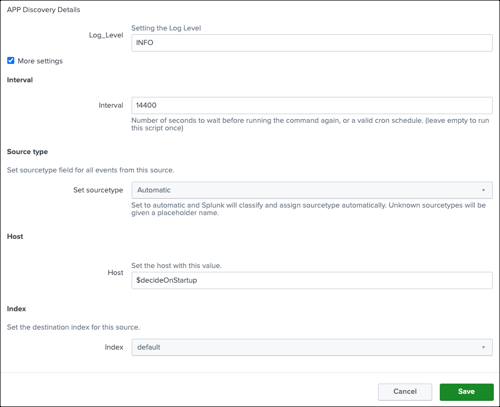
- For App Discovery Index, click Configure Index to add the Umbrella App Discovery log level, interval, source type, host, and index.
- For URL, enter the legacy Umbrella API URL:
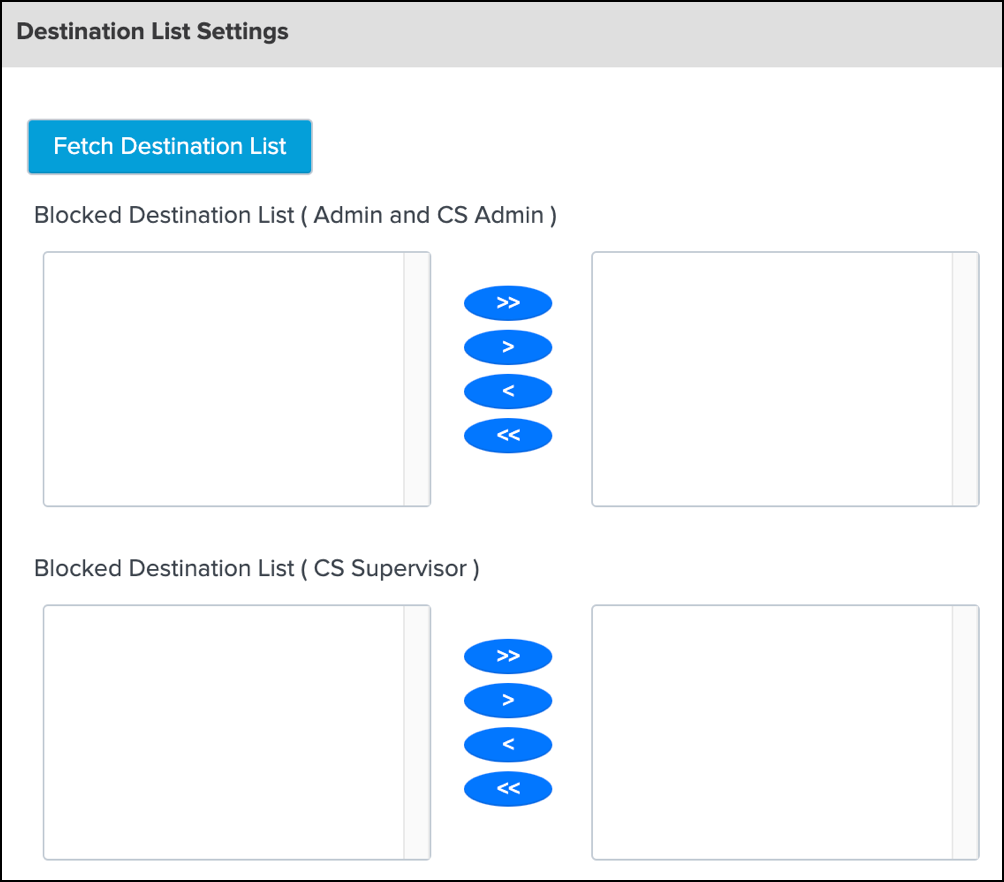
Destination List Settings
Navigate to Destination List Settings.
Enter the URL for the Umbrella API endpoint,
https://api.umbrella.com.Create an API key ID and key secret in Umbrella.
Encode the Umbrella API key and secret as a base64 string. For example, open a shell and run:
echo 'key:secret' | openssl base64 -A.Enter your base64-encoded credentials into the Token field.
Enter your Umbrella organization ID.
Click Fetch. The app displays your organization's blocked Umbrella destination lists.
For each configured Splunk role, add the blocked Umbrella destination lists to the app.
On your Umbrella dashboards, use the redirection and filter icons to add destinations from your blocked Umbrella destination lists. You can only choose blocked destinations not allowed destinations. For more information about managing destinations on the app, see Umbrella Destination Lists.
Note: Your Umbrella dashboards only display destinations that you add to the app from your blocked Umbrella destination lists. Once you add a destination to your Umbrella dashboards, you can use the redirection icon to remove the destination from displaying on the app.
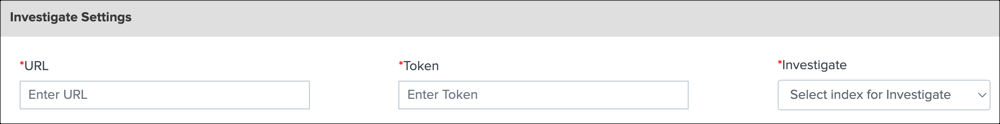
Investigate Settings
Navigate to Investigate Settings.
For URL, enter the Umbrella Investigate URL:
https://investigate.api.umbrella.com/.For Token, enter an Investigate API token that you generate on Umbrella. For more information, see Investigate API Authentication.
For Investigate, choose the index for Investigate.
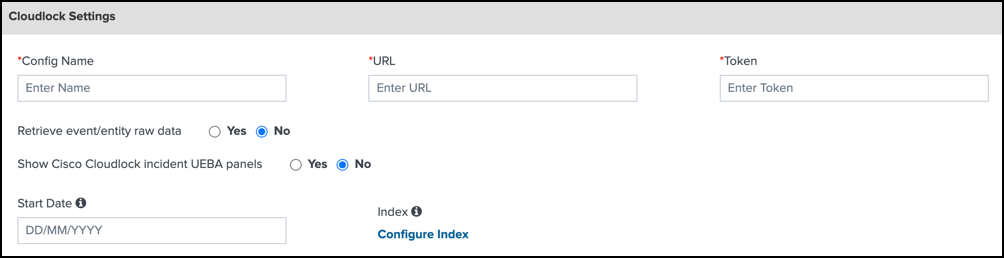
Cloudlock Settings
Navigate to Cloudlock Settings.
For Config Name, enter a meaningful name.
Obtain your Cloudlock URL from Cisco Cloudlock Support, and then add to URL.
Sample Cloudlock URL:
https://YourEnvironmentsAddress.cloudlock.com/api/v2Generate your Cloudlock API token in Cloudlock, and then add to Token. For more information, see Cloudlock API Authentication.
Choose Retrieve event/entity raw data to view event information about your incidents.
Choose Show Cisco CASB incident UEBA panels to view the UEBA panels.
Choose a Start Date. When Start Date is blank, the app fetches incidents for the last seven days. We recommend that you do not set a start date that is older than one month. A start date older than one month causes the app to fetch large amounts of data.
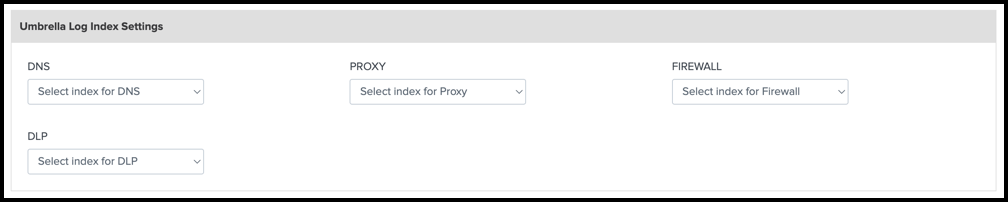
Log Index Settings
The Log Index Settings requires that you install the Cloud Security Add-On for Splunk. For more information, see Create New Inputs for Umbrella.
Navigate to Umbrella Log Index Settings.
Choose the appropriate index for each Umbrella event type to connect the inputs.
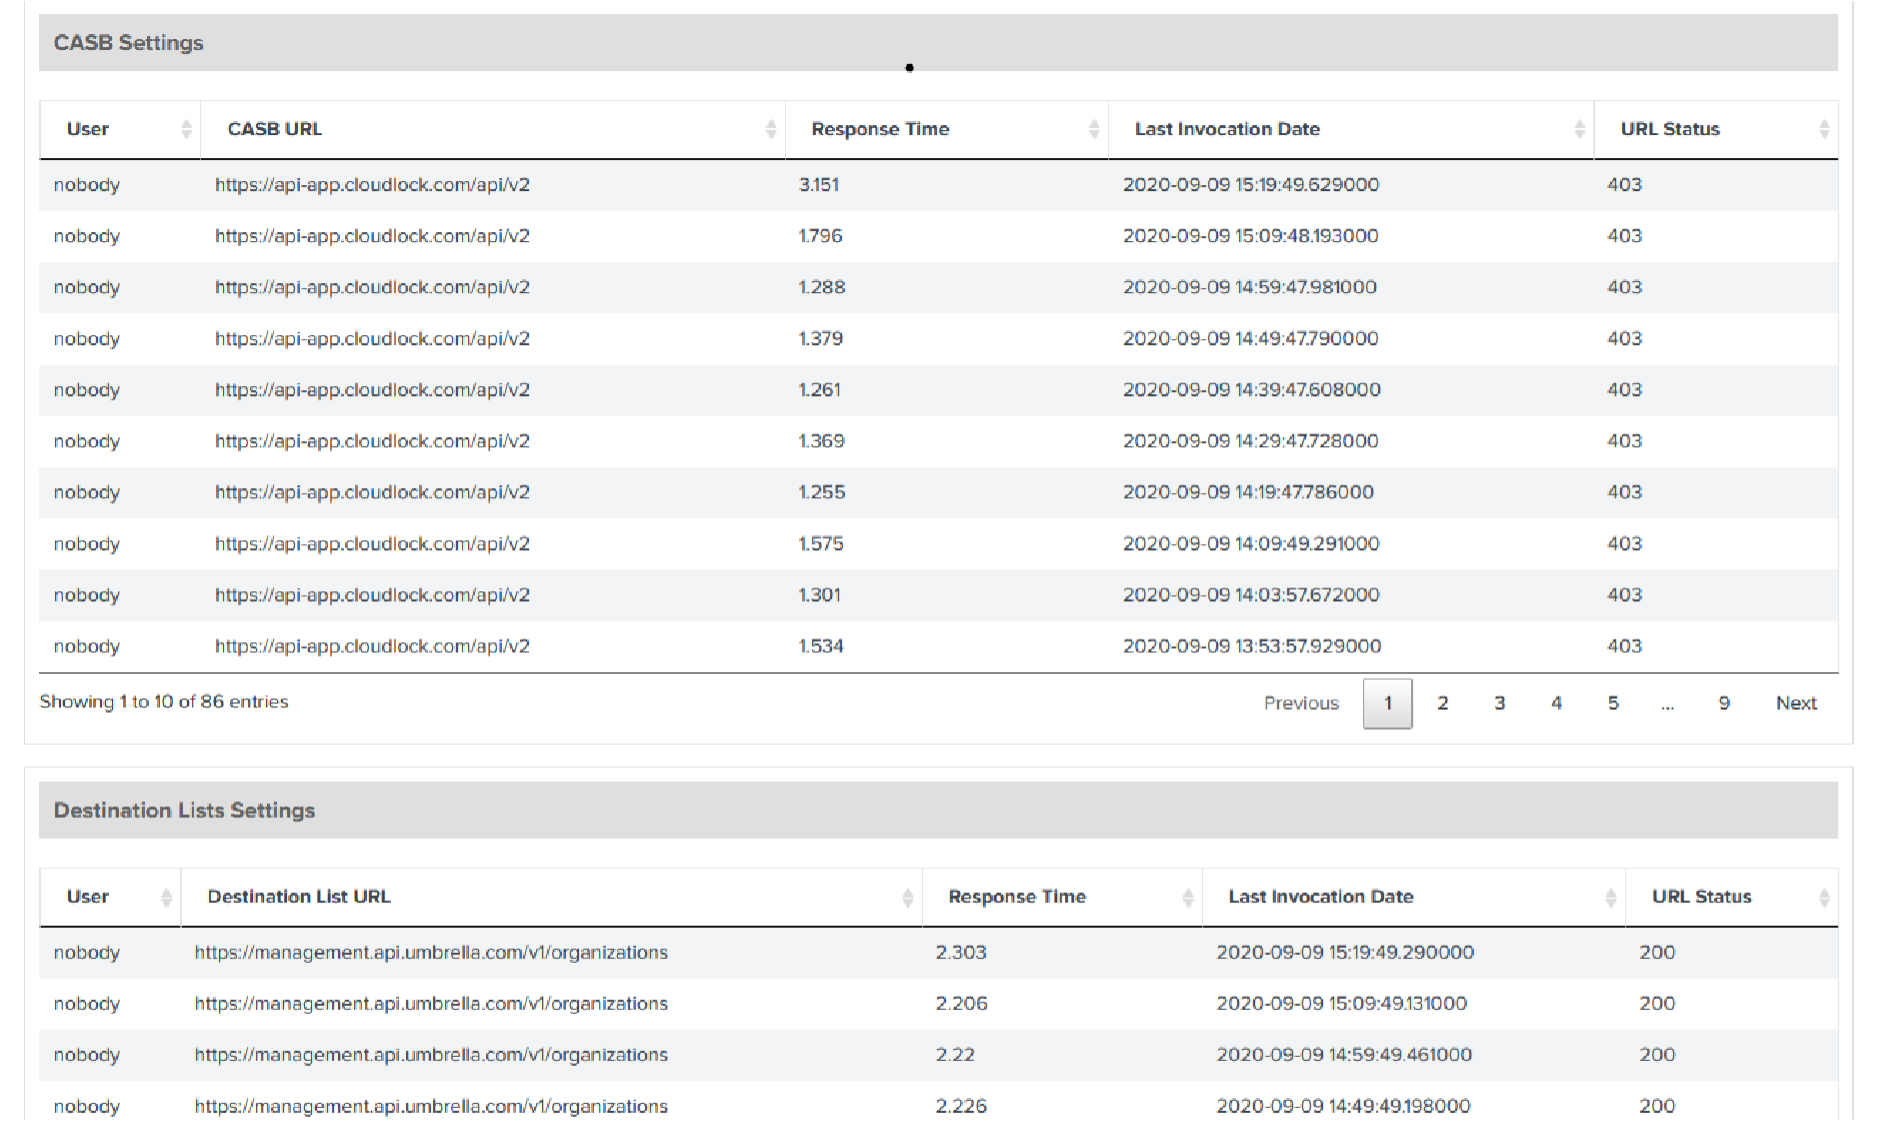
View Application Settings and API Health Status
View the history of the configured settings and the health status of the APIs.
Navigate to Application Settings.
Click View History to display Application Settings History.
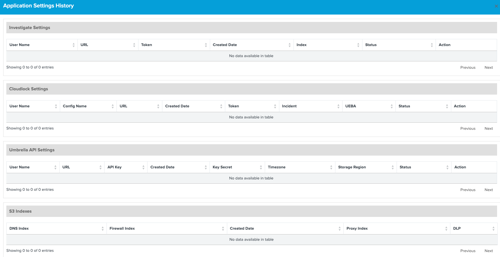
Click Health Status to display the status of the Cloud Security APIs integrated with the app.
Check Splunk Indexes
Check that Splunk receives events from Umbrella and applies the configured indexes. Query for each type of Umbrella event to view the indexed events.
- Navigate to the Search tab.
- Enter
sourcetype = cisco:umbrella:dnsin Cisco Umbrella DNS Logs—View Umbrella DNS events. - Enter
sourcetype = cisco:umbrella:proxyin Cisco Umbrella Proxy Logs—View Umbrella Secure Web Gateway (proxy) events. - Enter
sourcetype = cisco:umbrella:firewallin Cisco Umbrella Firewall Logs—View Umbrella Firewall events. - Enter
sourcetype = cisco:umbrella:auditin Cisco Umbrella Audit Logs—View Umbrella Audit events. - Enter
sourcetype = cisco:umbrella:dlpin Cisco Umbrella DLP Logs—View Umbrella DLP events.
Troubleshoot Application Settings
If you encounter errors in the Cloud Security Splunk App, we recommend that you verify your configured application settings.
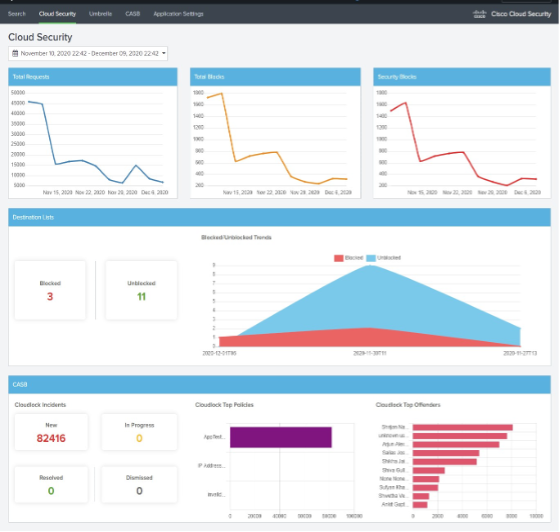
View Cloud Security Dashboard
The Cloud Security tab displays aggregated data from Umbrella requests, Umbrella destination lists activity, App Discovery reports, and Cloudlock reports.
- If the Umbrella and Cloudlock modules cannot connect to the Umbrella Destination Lists or Cloudlock APIs, the app may not display data on the Cloud Security page.
- View the status of the Umbrella Destination Lists and Cloudlock modules from Application Settings > Health. For more information, see View Configured Application Settings and API Health Status.
- Navigate to Cloud Security.
- Configure the time range for the data. If you do not set a time range, the app displays the data for the Last 1 Hour (last hour).
- (Optional) Choose one of the predefined date ranges, or click Custom to select Custom Date Ranges.
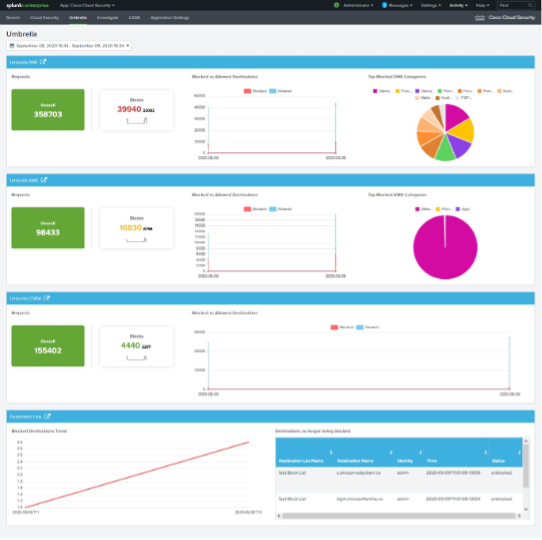
View Umbrella Dashboard
The Umbrella tab is available only when the Cisco Cloud Security Add-On is installed and configured. In Application Settings, select the indexes under Umbrella. For more information, see Create New Inputs for Umbrella.
The Umbrella tab contains the Umbrella DNS, Secure Web Gateway (SWG), Cloud Delivered Firewall (CDFW), and Destination Lists modules.
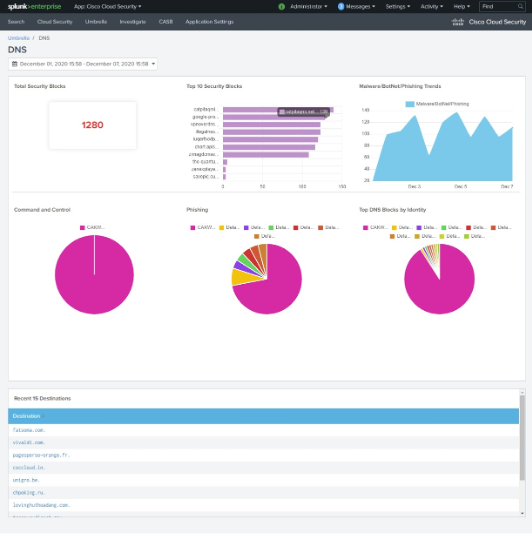
- Umbrella DNS—Displays the total request count, blocked requests, block trend for the specified time, blocked destinations compared to allowed destinations, and top blocked DNS categories.
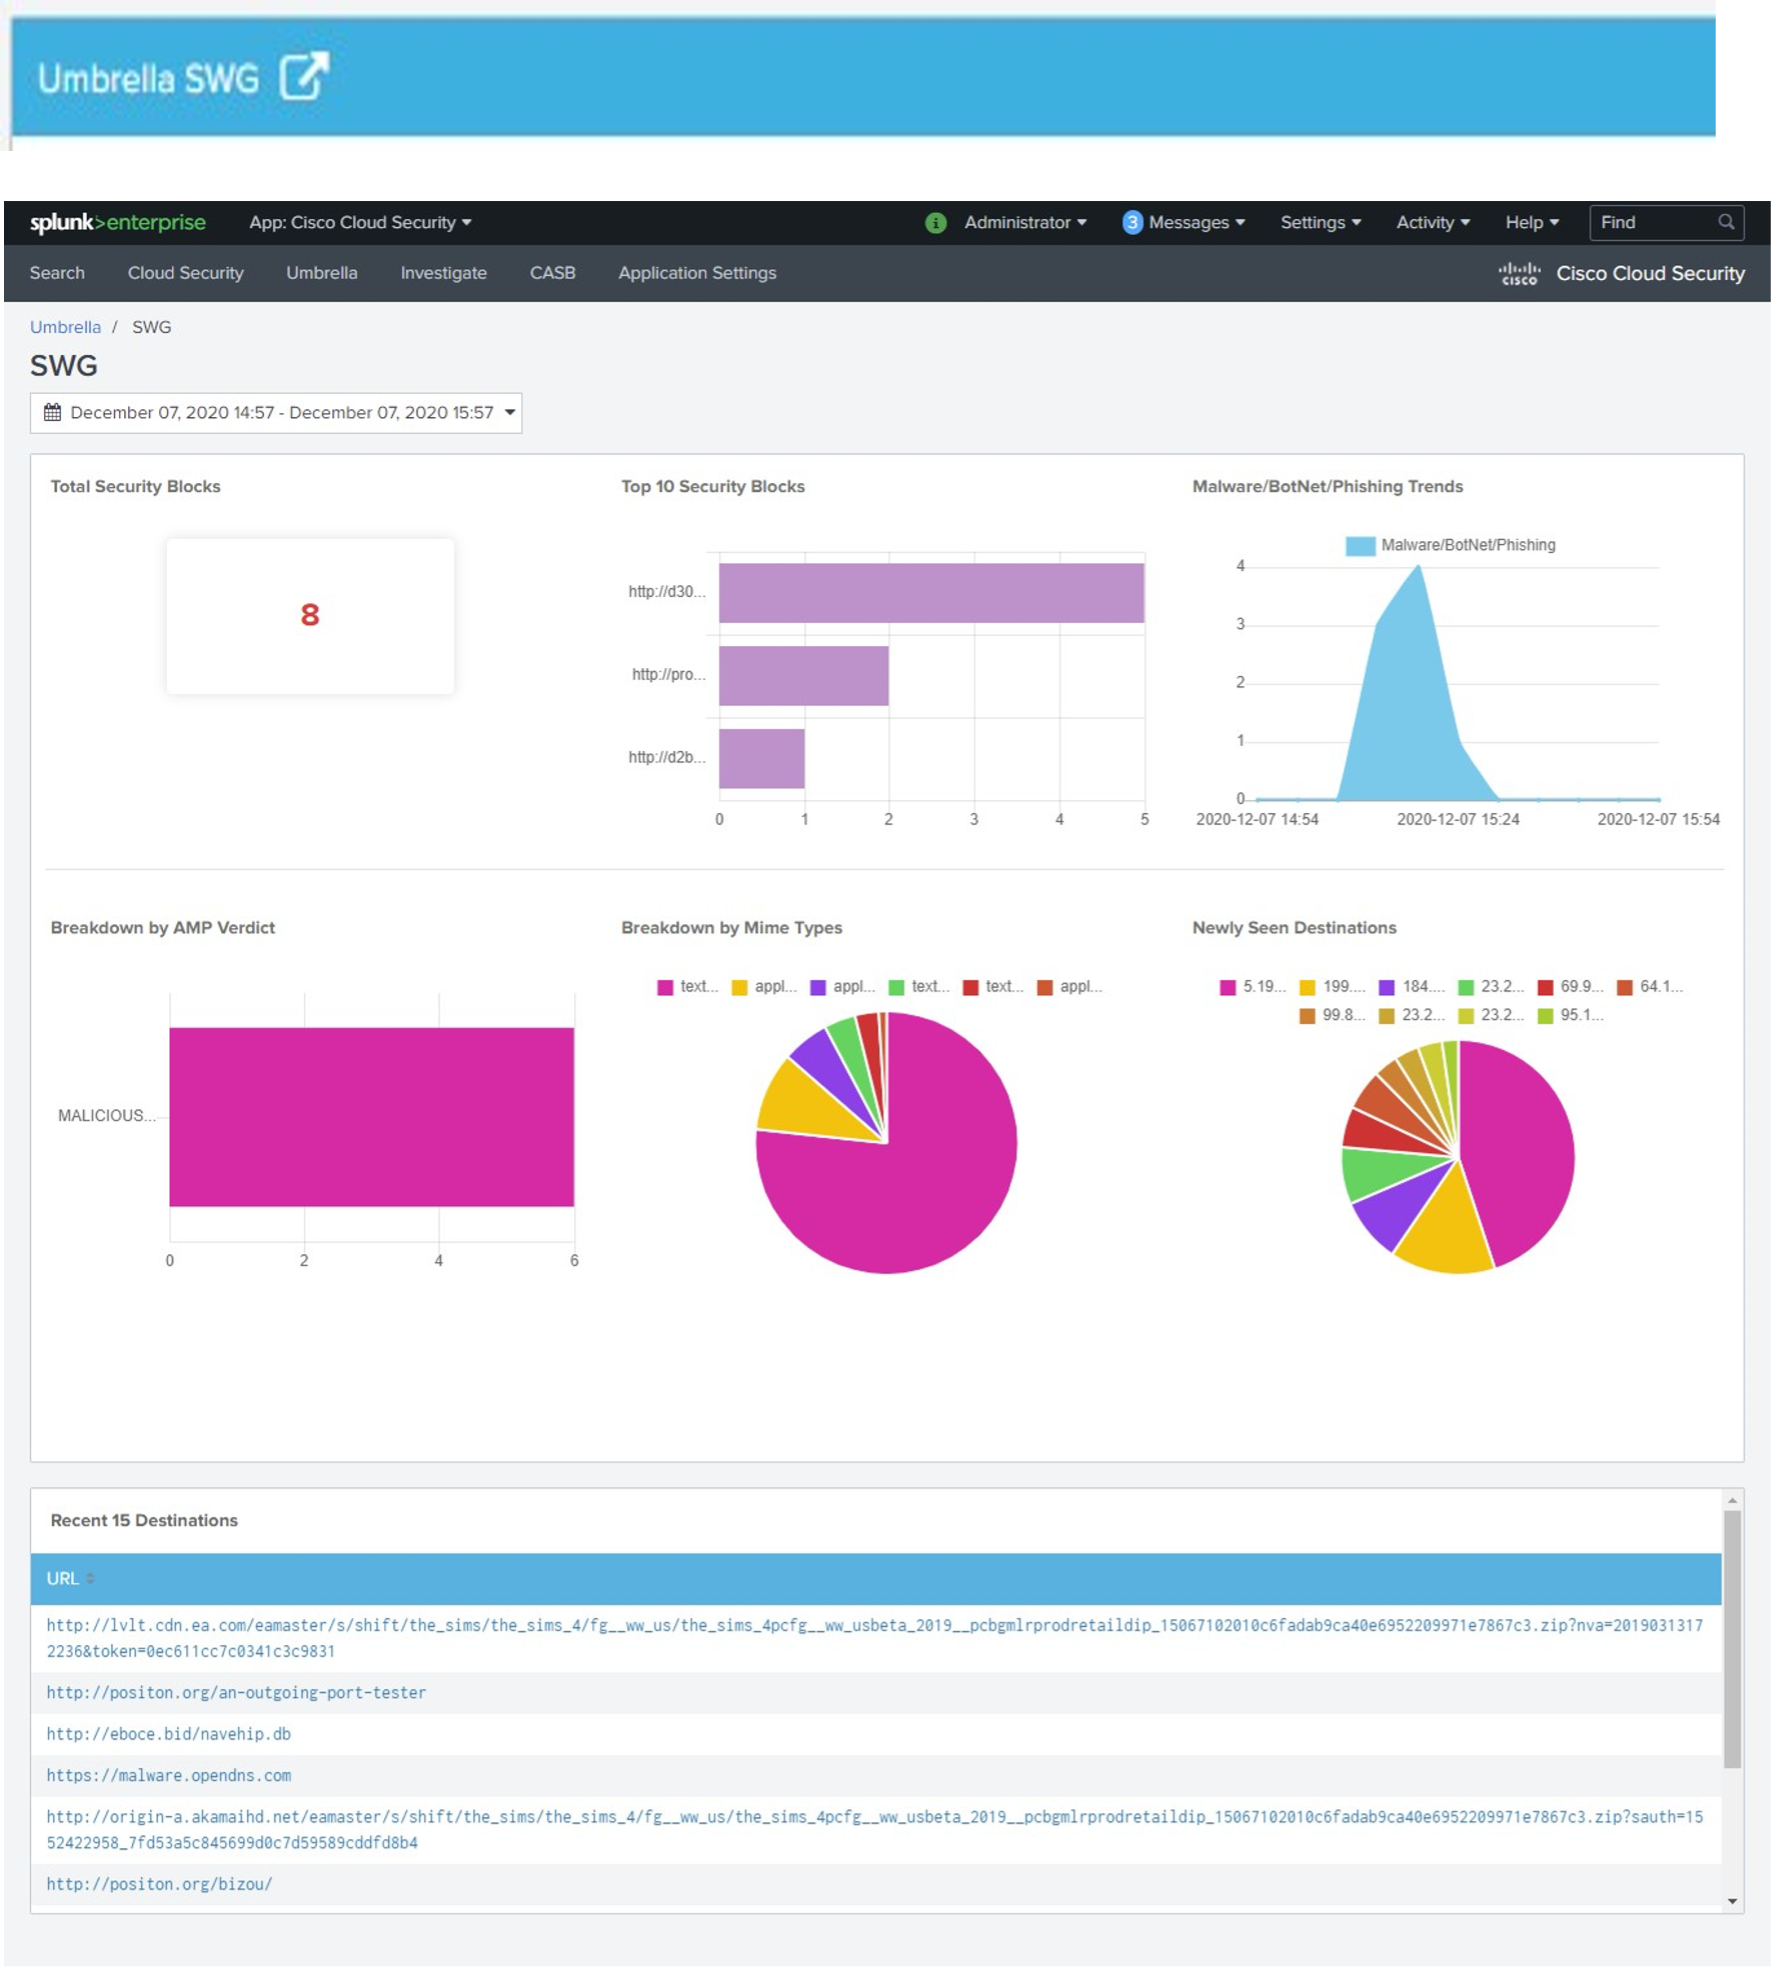
- Umbrella SWG—Displays the total request count, blocked requests, block trend for the specified time, blocked destination compared to allowed destination, and top blocked proxy categories.
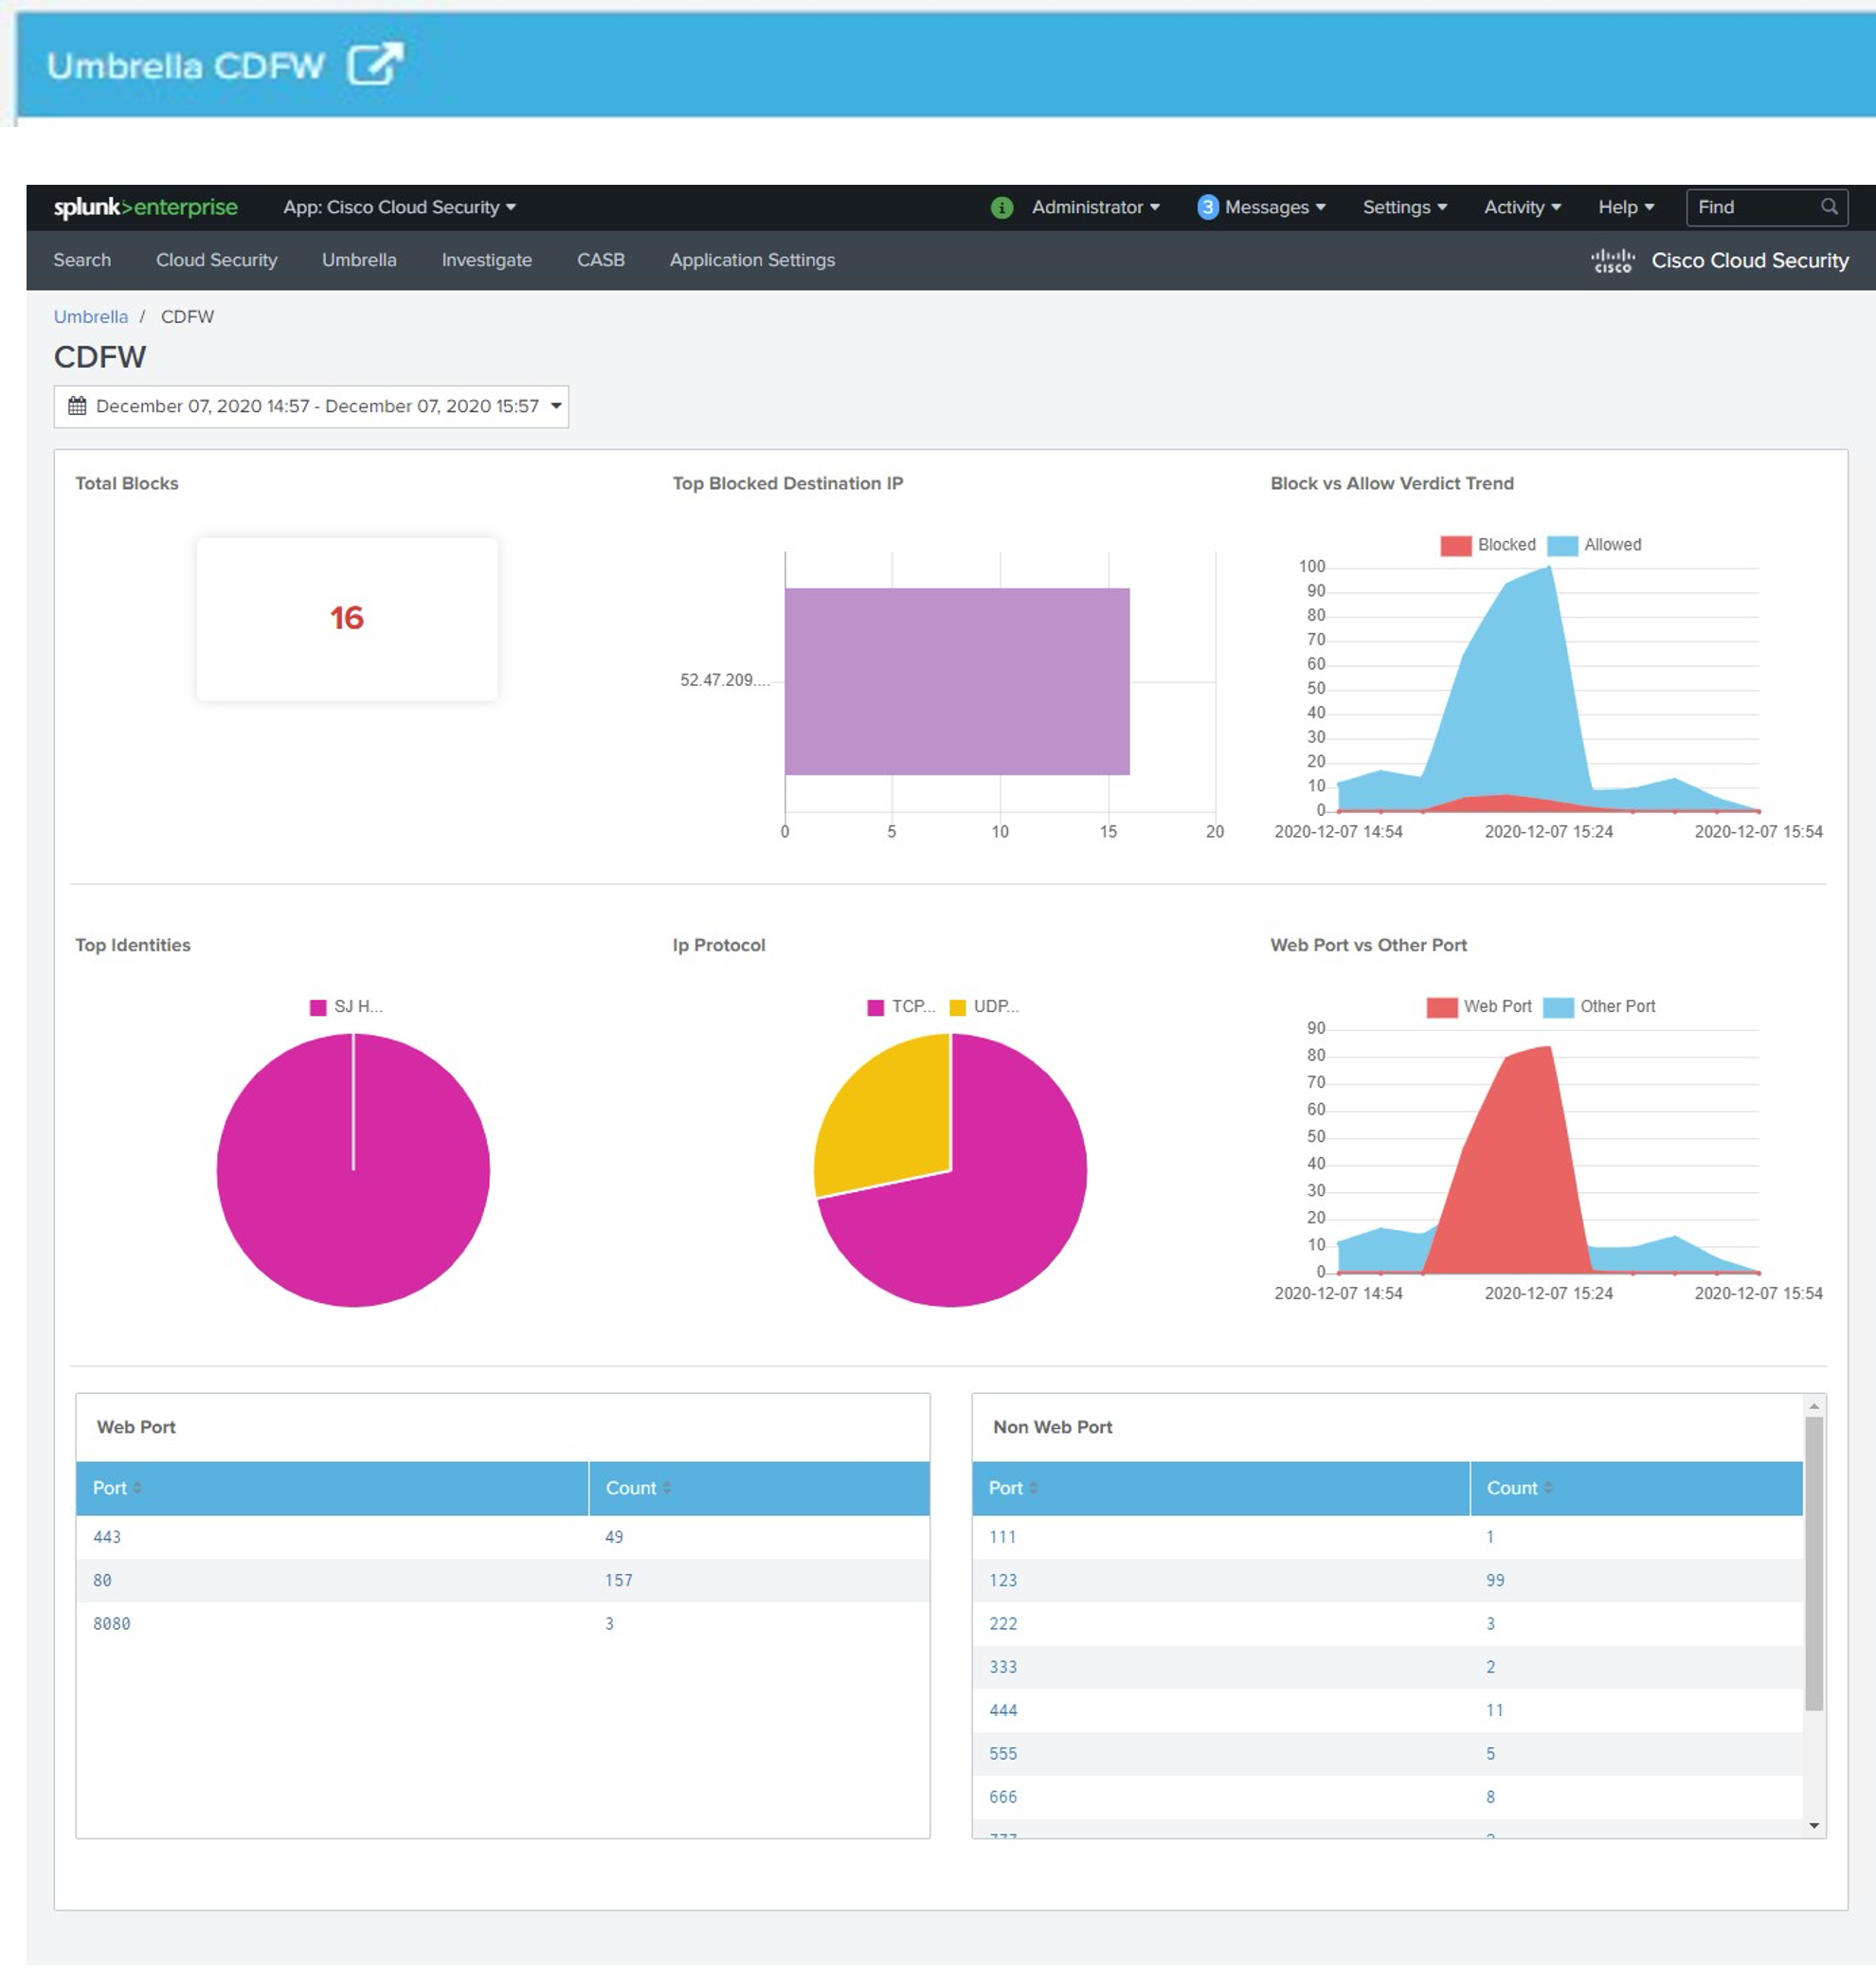
- Umbrella CDFW—Displays the total request count, blocked requests, blocked destinations for the specified time, and blocked and blocked with allowed destinations.
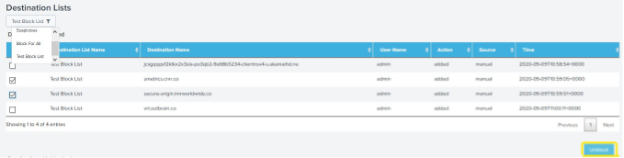
- Destination Lists—Displays the number of blocked destinations and destinations that Umbrella does not block.
- Navigate to Umbrella.
- Configure the time range for the data. If you do not set a time range, the app displays the data for the Last 1 Hour (last hour).
- (Optional) Choose one of the predefined date ranges, or click Custom to select Custom Date Ranges.
Umbrella DNS
Click the Umbrella DNS redirection icon.
Umbrella SWG
Click the Umbrella SWG redirection icon.
Umbrella CDFW
Click the Umbrella CDFW redirection icon.
Umbrella Destination Lists
Click the Umbrella Destination Lists redirection icon.

Use the filter icon to choose a destination list, and then select the destinations in the destination list to block.
View Investigate Dashboard
- If the Investigate module cannot connect to the Umbrella Investigate API, the app may not display data in the Investigate tab.
- View the status of the Investigate module from Application Settings > Health. For more information, see View Configured Application Settings and API Health Status.
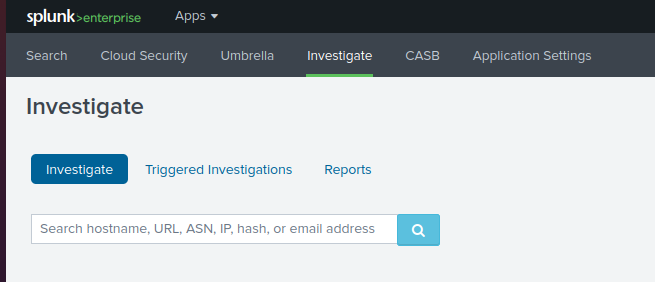
Navigate to Investigate.
Enter a domain name, IP, or URL in the search to query for detailed information about a destination.
Right click on a destination to block the destination.
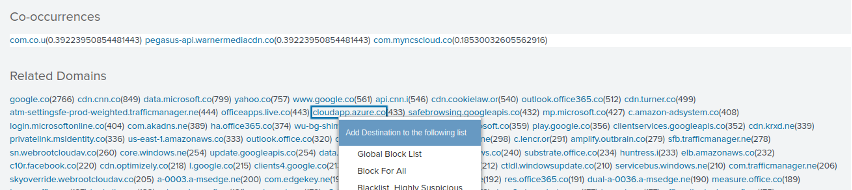
(Optional) Add a comment.
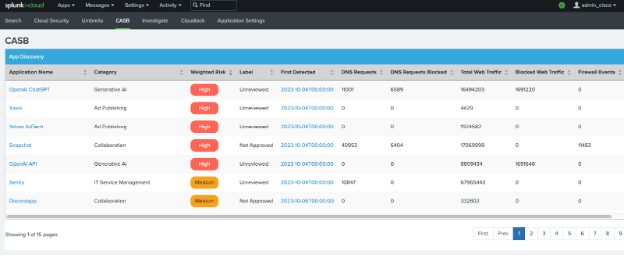
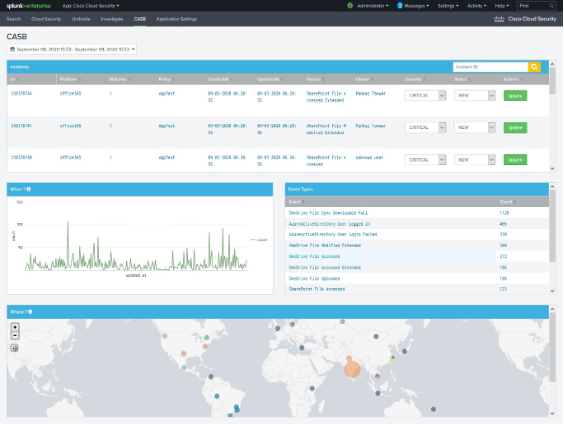
View CASB Dashboard
Navigate to CASB.
View the incidents about applications and related events on the app from the Umbrella App Discovery reports.
View Cloudlock Dashboard
The Cloudlock tab displays incidents about applications and related events on the app from the Cloudlock reports.
- If the Cloudlock module cannot connect to the Cloudlock API, the app may not display data in the Cloudlock tab.
- View the status of the Cloudlock module from Application Settings > Health. For more information, see View Configured Application Settings and API Health Status.
Navigate to Cloudlock.
Configure the time range for the data. If you do not set a time range, the app displays the data for the Last 1 Hour (last hour).
(Optional) Choose one of the predefined date ranges, or click Custom to select Custom Date Ranges.
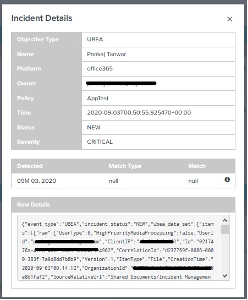
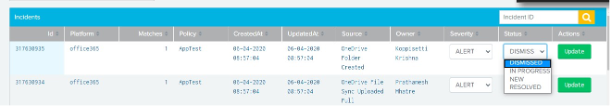
Click an ID to view the details about an incident.
(Optional) Choose the severity or status of an incident from the drop-down menu, and then click Update.
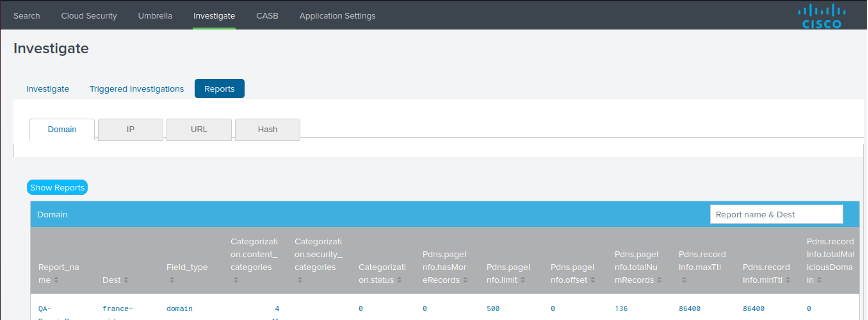
Configure Reports
Destination Reports
Navigate to Reports.
View the destinations generated in the Destination Report alert.
In the Search tab, run the
inputlookupcommand with an option to return the events for the type of destination.
| Destination | inputlookup command |
|---|---|
| Domain | inputlookup cisco_investigate_domains |
| IP | inputlookup cisco_investigate_ips |
| URL | inputlookup cisco_investigate_urls |
| Hash | inputlookup cisco_investigate_hashes |
Scheduled Reports
Choose Scheduled in Alert type to schedule the Cloud Security App report.
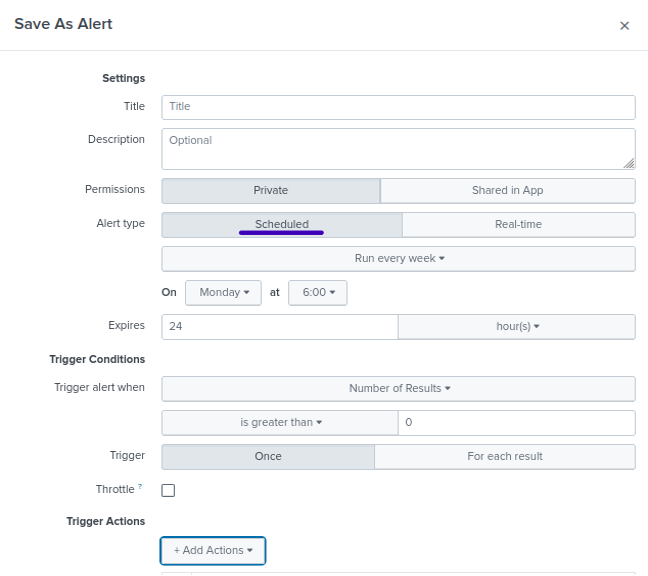
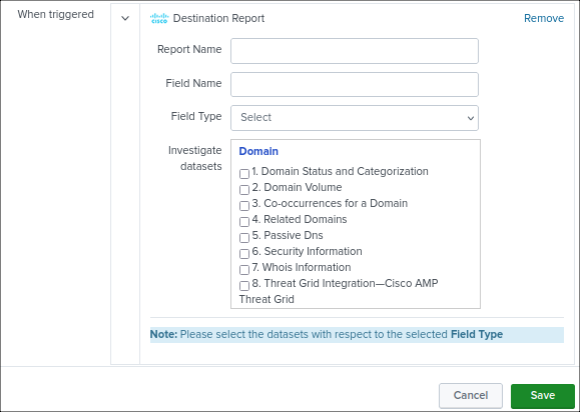
Choose Destination Report under Add Actions.
Enter a unique name for Report Name.
Enter a name for Field Name. Use one of the field types for the field name: Domain, URL, IP, or Hash.
Choose the type of the field from the Field Type drop-down menu.
Choose the Umbrella Investigate datasets based on the value of Field Type.
Choose the datasets that match the configured field type. If you select a dataset that does not match your field type, the app ignores the dataset.
Field Types and Related Datasets
| Field type | Dataset |
|---|---|
| Domain |
|
| IP |
|
| URL |
|
| Hash |
|
Configure Alerts
Configure Alert Actions on the app.
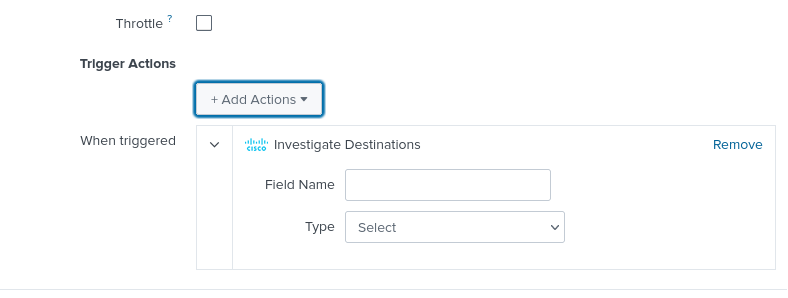
Investigate Destinations
Set up the Investigate Destinations alert to query a destination using the destination's type and field name.
- Enter the field name.
- Choose the type of the field. The field type is either URL, IP, or Domain.
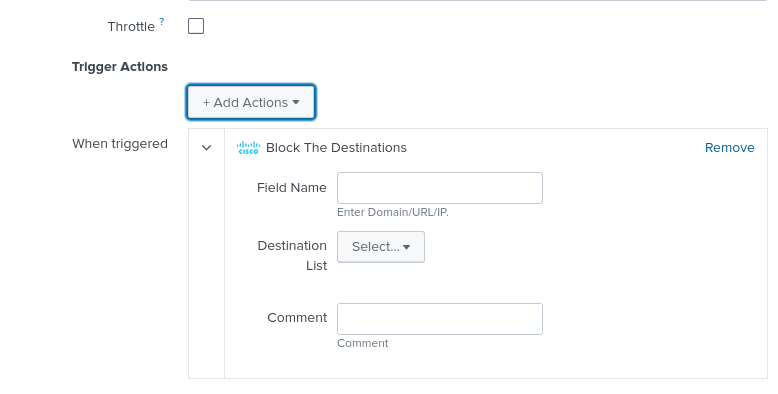
Block Destinations
Set up the Block the Destinations alert to block a domain, URL, or IP for the destinations found in a certain destination list.
- Enter the field name.
- Choose the destination list name.
Destination Reports
Set up the Destination Report alert to notify an admin about the availability of a blocked destinations report. For more information, see Scheduled Reports.
Support
If you have questions about the Cisco Cloud Security App, contact Cisco Umbrella Support.