Umbrella Investigate Add-On For Splunk
The Umbrella Investigate Add-On integrates Umbrella Investigate with Splunk Enterprise. In the Umbrella Investigate Add-On, you can view Umbrella event data, set up alerts for network and security events, and create reports and saved searches.
The Umbrella Investigate Add-On reads Umbrella data into the Splunk platform from your configured data sources.
- Umbrella DNS, Umbrella cloud-delivered firewall (CDFW), and Umbrella proxy logs
- Security information event management (SIEM) systems
- Threat intelligence platform
For more information, see Splunk Add-On for Investigate Datasheet.
Prerequisites
- Cisco Umbrella DNS or Cisco Umbrella SIG subscription
- Umbrella Investigate API license
- To run the
investigatefiltercommand in the add-on, you must have a Tier 2 or Tier 3 Umbrella Investigate API license. Tier 2 and Tier 3 Umbrella Investigate API licenses support bulk API requests. - For information about rate limits and the Umbrella Investigate API endpoints, see Investigate API Rate Limits.
- To run the
- Splunk administrative privileges
Umbrella provides the Umbrella Investigate Add-On for Splunk at no additional cost.
Download Investigate Add-On
Log in to Splunk and download the Umbrella Investigate Add-On from Splunkbase.
- Navigate to
https://splunkbase.splunk.com/app/3324/. - Choose a version of the Umbrella Investigate Add-On from the version drop-down list.
- Click Download to transfer the Umbrella Investigate Add-On package to your environment.
Install Investigate Add-On
Install the Umbrella Investigate Add-On using the Splunk app or the Splunk command-line interface (CLI).
Splunk app
- Navigate to the Apps menu.
- Click Manage Apps.
- Click Install app from file. Follow the instructions to upload the Umbrella Investigate Add-On file.
- Click Upload.
- Click Restart Splunk and confirm that you want to restart.
Splunk CLI
Run the following Splunk command to install the Umbrella Investigate Add-On package:
${SPLUNK_HOME}/splunk/bin/splunk install app cisco-umbrella-investigate-add-on_0100.tgz -auth <username>:<password>
Note: To complete the installation of the Investigate Add-On, you must restart the Splunk node.
Install Add-On in Distributed Splunk Cluster
- In a distributed Splunk cluster, you must install
investigate_input.py(input script) on one of the search head nodes. - In a clustered environment, include the localop command before the investigate filter command in the index setting.
Runtime Dependencies
The Umbrella Investigate Add-On is versioned and only interoperates with certain versions of Splunk Enterprise and Python.
| Umbrella Investigate Add-On | Splunk | Python |
|---|---|---|
| 0.7.0 | 7.3 | 2.7 |
| 0.8.1 | 7.3 | 2.7 |
| 0.10.0 | 8.0, 8.1, 8.2 | 2.7, 3.4 |
If you are using version 0.8.1 of the Umbrella Investigate Add-On and Splunk version 7.3, you must install certain Python 2.7 libraries into Splunk's Python environment.
- Install Python 2.7 libraries.
futurereprlib
- Copy the libraries to
${SPLUNK_HOME}/lib/python2.7/site-packages.
Third-Party Python Libraries
The Umbrella Investigate Add-On imports third-party libraries.
Note: When using third-party libraries, we recommend that you review the licensing agreement for each library.
Umbrella Investigate Add-On Version 0.10.0
Version 0.10.0 of the Umbrella Investigate Add-On modifies the add-on directories and introduces third-party Python library updates.
- Updates to imported third-party Python libraries:
dateutil(v2.8.1)splunklib(v1.6.16)pyinvestigate(v1.10.1)IPy(v1.01)
- Remove
viewstates.conffrom the default folder. - Specify
python3as the Python version in all scripts and commands. - Move
splunklibto/lib. Splunk versions 8.0 and 8.1 require apps to locatesplunklibin the/bindirectory.
Set up Your Investigate API Credentials
The Umbrella Investigate Add-On requires an Umbrella Investigate API key to authenticate requests to the API. For more information about creating an Umbrella Investigate API key, see Umbrella Investigate API Authentication.
Add your Umbrella Investigate API key to the add-on.
- Navigate to the Apps menu.
- Click Manage Apps.
- Find the Umbrella Investigate Add-On item.
- Click Set up to load the setup page for the add-on. The Managed Apps page is found under the gear icon from the main launch page.
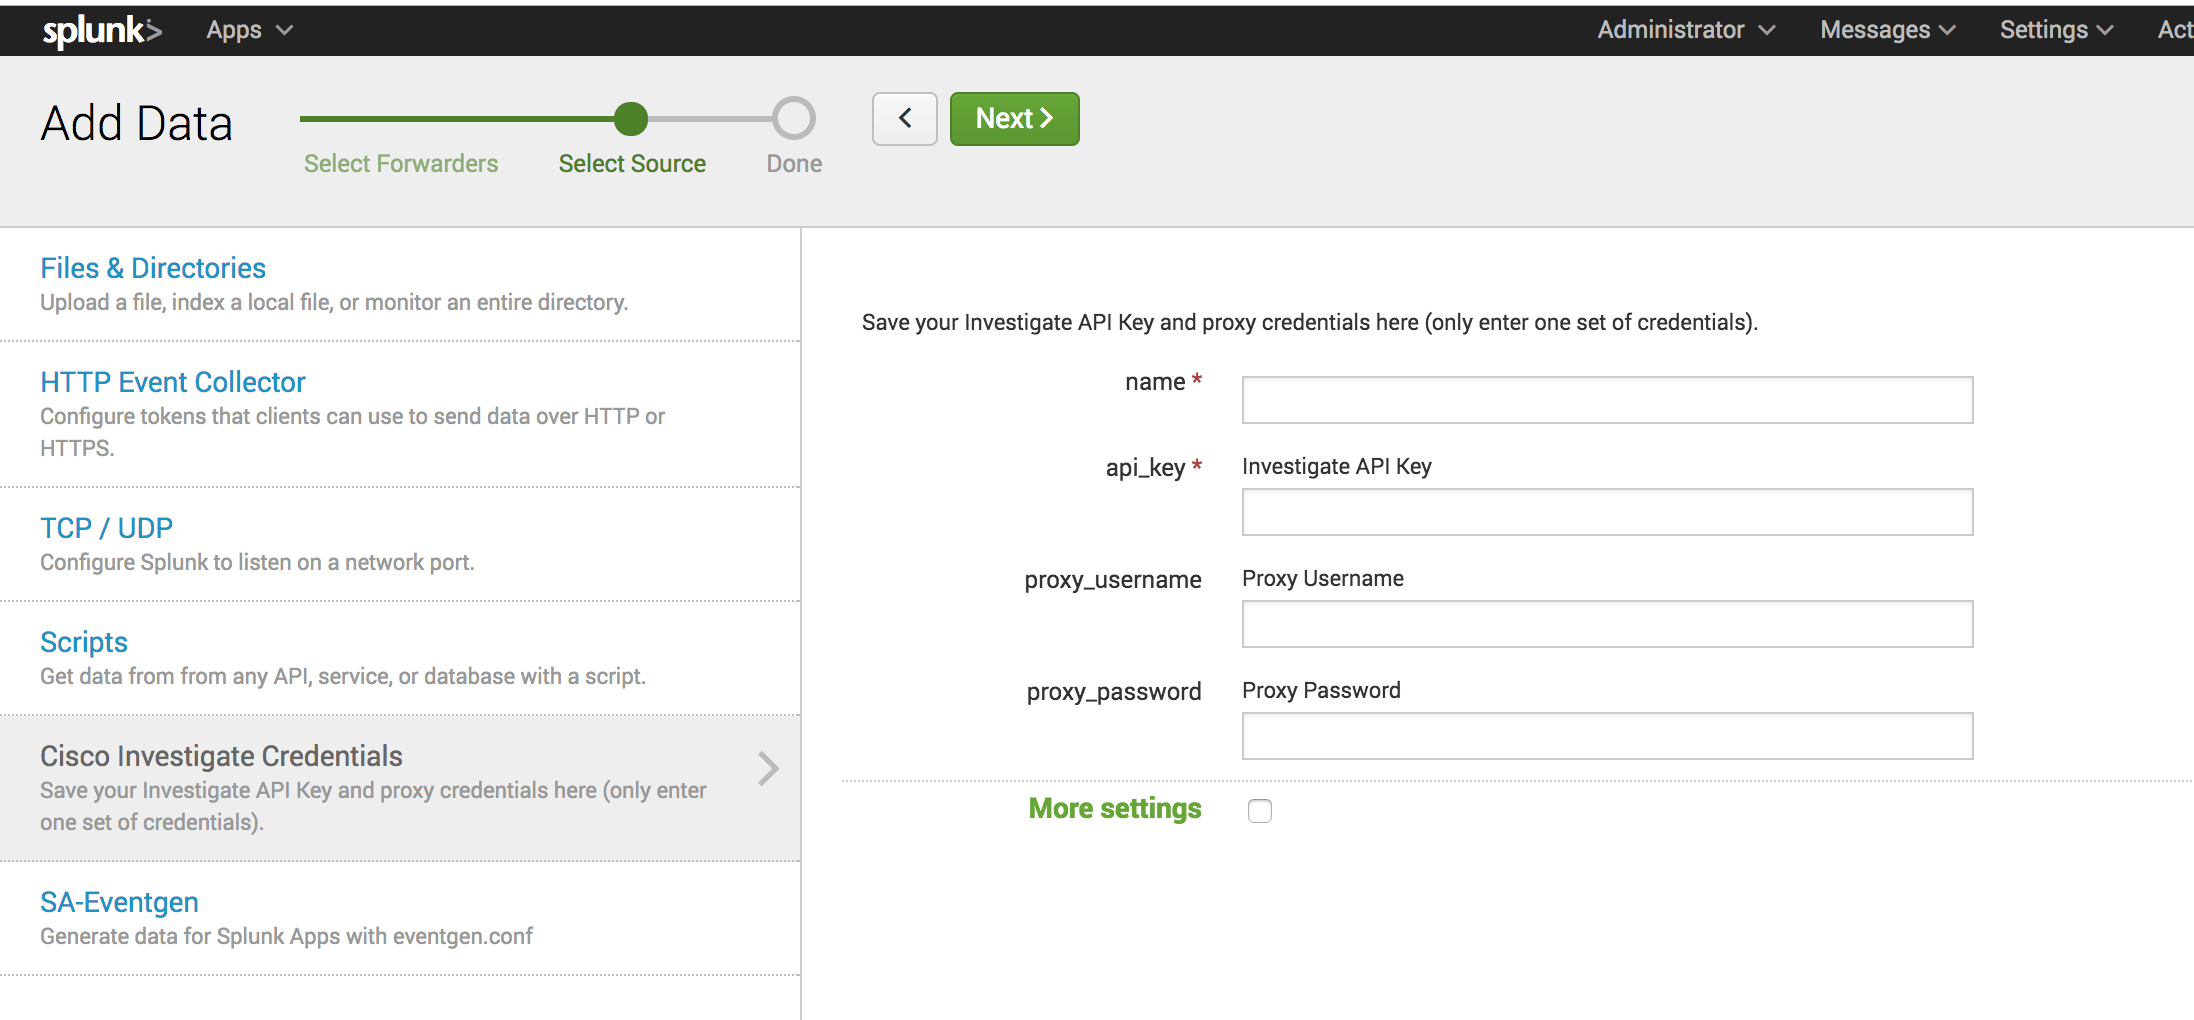
- Navigate to Settings > Data Inputs > Cisco Investigate Credentials.
- Click Add new.
- Enter a name and your Umbrella Investigate API key.
- (Optional) Add your proxy username and proxy password.
- Click Next. Splunk encrypts and saves your API key.
Note: If your Umbrella Investigate API key changes, you must update the API key in the add-on.

Create a Scheduled Search
Create a scheduled search to retrieve domain, IP, or file hash data from the Umbrella Investigate log files. The Splunk scheduled search queries for data within a specified time range. Do not schedule multiple searches to run simultaneously. Overlapping scheduled searches can lead to performance issues within Splunk.
Navigate to Settings > Searches, reports, and alerts.
Click New Report.
Choose Cisco Umbrella Investigate (opendns_investigate) from the App drop-down menu.
- Add the title of the report in Manage Apps. For more information, see Configure Fields.
Navigate to Actions and click the Edit drop-down menu. Choose Edit Permissions to change the display for App. You may change the permission of this search for the app to display the reports.

Note: Check that the add-on and the user account has permission to view the search report. The scheduled search name is case-sensitive and must match the name.
Enable Scripted Input
Enable scripted input for the add-on.
- Navigate to Settings > Data Inputs.
- Under Local Inputs, click Scripts.
- Click to enable the scripted input file:
${SPLUNK_HOME}/etc/apps/opendns_investigate/bin/investigate_input.py. - Configure the schedule for the script.
The investigate_input.py script uses the functionality in investigate_exclusion_list_input.py to download the top one million domains and add them to user_exclusion_list.
Import a Data File
Upload a data file to the add-on.
- Select Settings > Add Data > Upload.
- Select the data file to upload and click Next.
- Set the Source Type, then click Next.
- Create a new index or choose a saved index.
- Click Review, and then click Submit.
Saved Search Examples
The following saved search example filters the dest_host_blocked field for requests in the firewall_logs index.
index=firewall_logs earliest=-2h latest=-1h | fields dest_host_blocked
Note: To use conditional logic (like, <, or >), add a where clause.
In the Umbrella Investigate Add-On saved search, you can set the cs_host field to a single host. For example:
index=firewall_events earliest=-2h latest=-1h cs_host=adobe.com | fields cs_host, cs_hash
Note: Your data sources determine how you can construct saved search queries as an index. Umbrella Support may be unable to recommend the appropriate fields for your indexes.
Configure Fields
Navigate to Manage Apps.
Find the Umbrella Investigate Add-On item.
Click the Setup link to load the configuration page for the add-on.

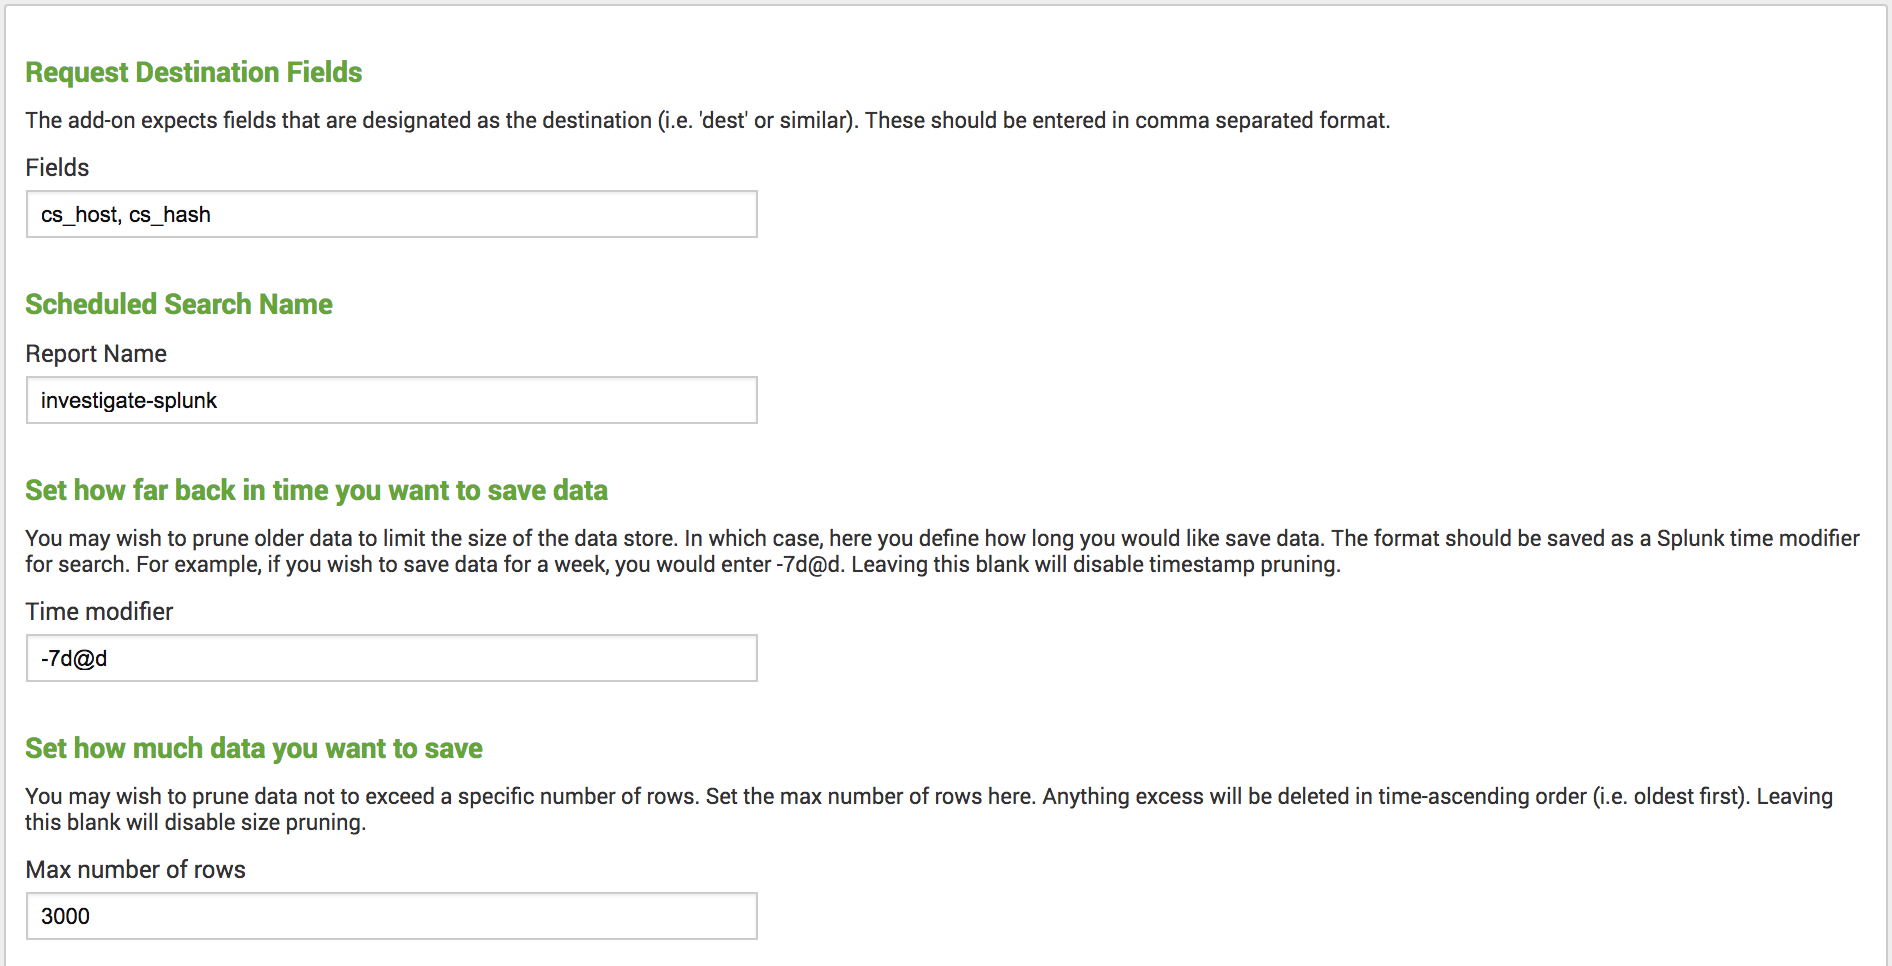
Set up the destination and scheduled search fields.
- Request Destination Fields—Represents the same information that you can include in the Umbrella Investigate pattern search:
domain,host, anddestination. Provide the domain, IP, and file hash information. Separate multiple field values with a comma. - Scheduled Search Name—The name of the saved search. Use this name when retrieving domain information. For more information about scheduling a search, see Create a Scheduled Search.
- Request Destination Fields—Represents the same information that you can include in the Umbrella Investigate pattern search:
To prevent the data store from exceeding a certain size, set up the data store pruning parameters.
- Set how far back in time you want to save data—To limit the size of the data store, define the time period to store the data. Format the time range using the Splunk time modifier for search. For example, to save data for a week, enter
-7d@d. Leaving this field blank disables timestamp pruning. - Set how much data you want to save—To prune data to a specific number of rows, set the maximum number of rows. The add-on deletes any excess data in time-ascending order (oldest to most recent). Leaving this field blank disables size pruning.
- Set how far back in time you want to save data—To limit the size of the data store, define the time period to store the data. Format the time range using the Splunk time modifier for search. For example, to save data for a week, enter
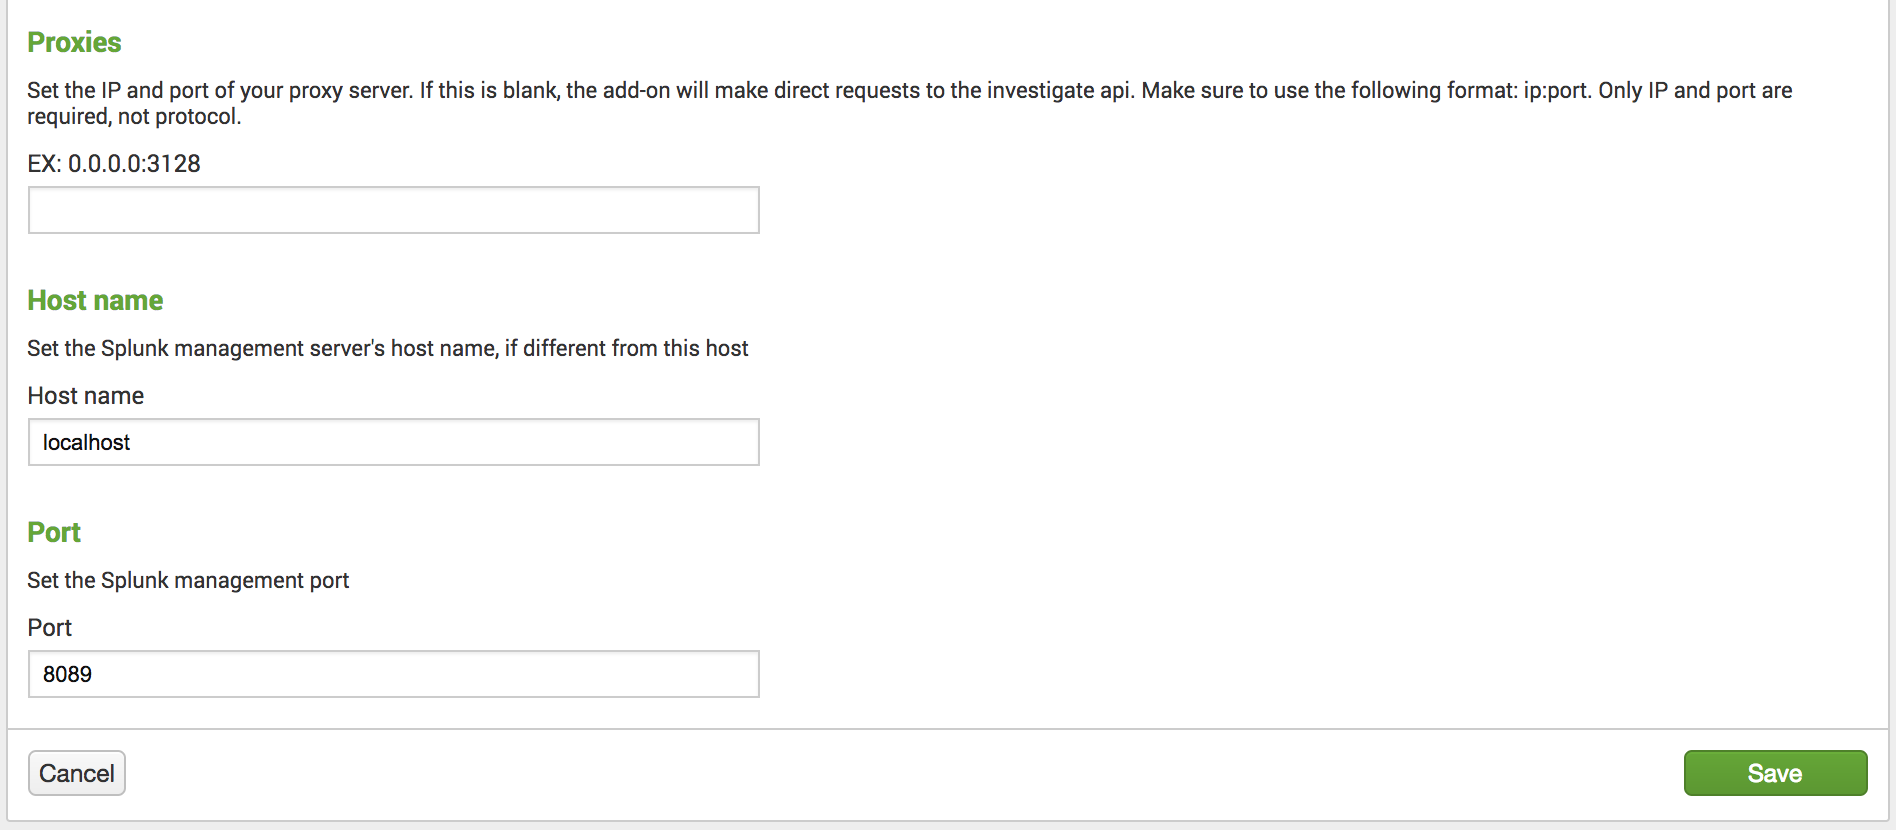
(Optional) Define the settings for your proxy server, including any nonstandard Splunk host and port.
- Proxies—Set the IP and port of your proxy server. Use the following format:
ip:port. The add-on does not require the protocol. If you do not complete this field, the add-on makes direct connections to the Umbrella Investigate API. We currently only support http or https proxying. SOCKS proxies are not supported. - Host name—If the Splunk management server has a different hostname than your host, set the hostname of the Splunk management server.
- Port—Set the Splunk management port.

- Proxies—Set the IP and port of your proxy server. Use the following format:
App Usage
- You can expect a maximum throughput of 5,000 unique domains per hour. A saved search should not contain more than 5000 domains.
- Use the scheduled search for domains that are configured to alert on your security events in a SIEM or other managed storage system.
Note: You cannot use the scheduled search to view your entire set of Umbrella logs. Splunk and Umbrella Investigate limit the rate of requests and data volume that your Splunk instance processes.
Key Collectors and Search Commands
A key collector matches a set of Umbrella Investigate API results.
The Umbrella Investigate Add-On defines several key collectors.
- Domains
- IP addresses
- File hashes
To view the contents of the Umbrella Investigate key-value store, create a Splunk search providing the key collector query name.
The
investigate_domainsquery generally covers the same fields that are provided by the Umbrella Investigate API. The fields represent the autonomous system number (ASN) of the domain, the matching content categories, any co-occurrences or related domains, general status (malicious or unknown), and WHOIS data. To query for domains, run:| inputlookup investigate_domains
The
investigate_ipsquery describes the destination (IP address), the last queried time, the DNS resource record (RR) history for that IP, and the labels for the domains that resolved to this IP. To query for IP addresses, run:| inputlookup investigate_ips
The
investigate_hashesquery describes antivirus results and network connections, file type (magic type), and security categories. To look up destinations by file hashes, run:| inputlookup investigate_hashes
Use standard data sorting techniques to build queries. For example:
| inputlookup investigate_domains | where not isnull('cooccurrences.0') | fields dest, cooccurrences.0, status_label, last_queried | sort -last_queried
investigatefilter Search Command
The investigatefilter search command filters the search results by the status of the host. You can set the status and host_field parameters with the command. The status parameter is equivalent to the status (-1, 0, or 1) provided by the Umbrella Investigate API. If you do not set the status parameter, the app filters the query using the default status of -1 (malicious).
Before you run the investigatefilter command, check that you meet the prerequisites of the add-on.
- You must have access to an Umbrella Investigate API Tier 2 or Tier 3 license to run the
investigatefiltersearch command. For more information, see Prerequisites. - Sign in with the
Cisco Investigateapp context to use theinvestigatefiltersearch command.
The following command filters out indices with a host_field set to host. For example:
index=proxy_logs | investigatefilter host_field=host
To filter out indices to only include hosts that are considered safe, run:
index=proxy_logs | investigatefilter host_field=host status=1
Schedule Data Store Pruning
To manage the data that are collected in the Umbrella Investigate Add-On key-value store, set up the investigate_prune_kv.py input script.
The investigate_prune_kv.py script defines these methods:
- time-based—Delete entries older than a specified time modifier, for example:
-7d@d. In this example, the add-on deletes data older than seven days. - size-based—Set the maximum number of rows permitted in a collection. The script deletes rows from the key-value store in time-ascending (starts at the beginning of the collection) order until the number of rows is equal to the maximum.
For information about how to set up the pruning interval and size limits of the datastore, see Configure Fields.
- Navigate to Setup.
- Navigate to Data Inputs under Settings.
- Under Local inputs, click Scripts.
- Click to enable the script:
${SPLUNK_HOME}/etc/apps/opendns_investigate/bin/investigate_prune_kv.py. - Configure the schedule for the script.
Support
If you have questions about the Umbrella Investigate Add-On, contact Cisco Umbrella Support.