Writing Custom KPIs
The following sections explain how to create custom KPIs for use with Cisco Crosswork Health Insights.
What are KPIs?
A Cisco Crosswork Health Insights Key Performance Indicator (KPI) is a programming construct that captures network device and health metrics. Crosswork Health Insights provides stock KPIs that you can start using right away, with minimal configuration (see Health Insights Stock KPIs).
The power of the Health Insights application comes from the ability to create custom KPIs, and to define custom alerts that the KPI will raise when it detects anomalies. You can then remediate detected anomalies manually, or by linking the KPI to one of the Crosswork Change Automation application's Playbooks and then triggering the Playbook when the alert is raised.
This guide will help you get an overview of the stock Crosswork Health Insights KPIs and how to create a custom KPI from a stock KPI.
Importance of KPIs
A KPI is a powerful, modern tool which collects data based on defined parameters, reports it, and alerts users when anomalies are detected. KPIs use lightweight, reliable and secure Model-Driven Telemetry (MDT) and SNMP polling to gather network and device data. The gathered data is then evaluated based on operator-configured settings in Crosswork.
When KPI data indicates a deviation outside established parameters, Crosswork alerts the operator. The response to the alert can be entirely manual, or semi-automated by linking the KPI to a Crosswork Change Automation Playbook, which the operator can then decide to trigger. Linking a KPI to a Playbook also allows the Playbook to get the execution variable values it needs directly from the incoming KPI alert, and indirectly from the configured KPI.
KPI Elements
A KPI contains the elements shown in the following table. For an example of these elements and their values in a stock KPI, see Inside the CPU Threshold KPI.
|
Element |
Description |
|---|---|
|
KPI_Name |
The name of the KPI. This is preset by Cisco in stock KPIs, but user-defined in custom KPIs. |
|
KPI_ID |
A unique internal KPI identifier, used (instead of the KPI Name) to distinguish the KPIs from each other when called by the Crosswork Health Insights application. |
|
Summary |
A one-sentence text summary of what the user wants the KPI to track. |
|
Details |
A more detailed text description of the KPI and its functions. |
|
Category |
The name of the KPI’s category. This is used in the Crosswork Health Insights application user interface to group KPIs in lists. |
|
Sensor_paths |
The telemetry path to the device or network health metric the KPI will be tracking. This will be either a leaf YANG path if using Model Driven Telemetry (MDT), or a YANG representation of an SNMP OID if telemetry is SNMP-based. The Crosswork Health Insights application user interface also provides a context-free keyword search of both YANG and SNMP sensor paths, for users who do not already know the sensor path they want to choose. |
|
Path_id |
The leaf-level specification of the data that needs to be collected. |
|
Cadence |
The data collection interval specified in minutes. The minimum interval supported is 1 minute for MDT collections, 5 minutes for SNMP collections. |
|
Alert definition |
This element defines how a KPI detects an anomaly and how alerts for the detected anomaly are raised. It can be left blank, in which case the KPI is considered a passive reporting KPI. Non-passive alert definitions fall into three types:
Alert definitions also define the KPI type. |
|
Parameters |
A set of user-defined or default values that define the conditions for KPI execution. |
|
Script |
An auto-generated TICKscript that uses the values from the Parameters element as input. |
|
Dashboards |
These elements provide options for tracking the reported data in the Crosswork Health Insights graphic user interface. |
|
Sensor-Type |
User-defined default values to track collection updates. |
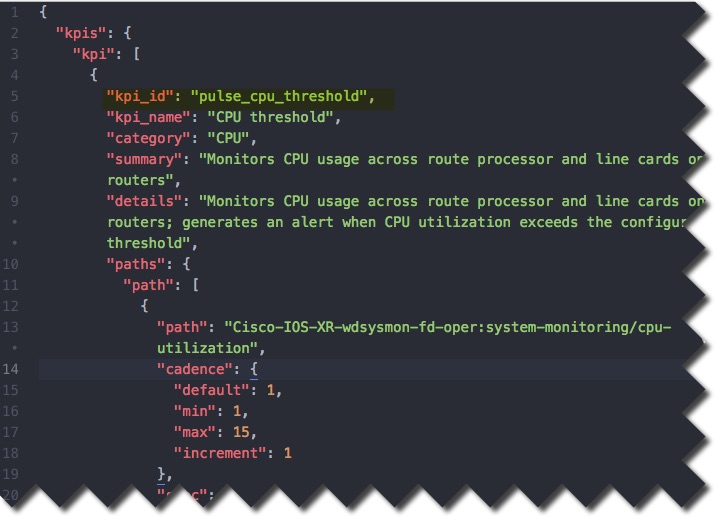
The following figure shows the first five of these elements as they appear in the KPI file (see KPI Files).
KPI Types
Cisco Crosswork Health Insights KPIs are classified based on the type of alert actions they perform:No-Alert State
KPIs in this category are solely for reporting purposes, such as with KPIs that report installed software versions or monitor device uptime. They collect data and report it based on the definitions in the Parameters element. These alerts are used for data collection and visualization.
Rate Change
KPIs in this category report data and generate alerts whenever the TICKscript detects an abnormal rate of change (rising or falling) in measured values. This is a derivative-based template. It can be used in scenarios such as detecting interface state changes, interface errors, and so on.
Standard Deviation
KPIs in this category report data and generate alerts based on statistical thresholding. These alerts are cleared based on the definitions in the Parameters element.
These KPIs generate alerts based on a formula, which is the general definition of Standard Deviation (defined as the square root of Variance, where Variance is the average of the squared differences from the Mean, and the Mean is the average of the reported values). They report an alert whenever the data is a given degree of standard deviation from the norm, which usually means there is a sudden spike or drop in the data. There is also an activation threshold, which sets the minimum value the data must present for an alert to be generated, so only spikes or drops that reach a certain raw value are significant. If the alert activation threshold is -1, it is always ignored. Data points are collected based on the value of the Cadence element.
Two-Level Threshold
The KPIs defined under this category report data and generate alerts whenever the values breach or cross a defined set of standards. Alerts are cleared when performance returns to the user defined acceptable level based on the definitions in the Parameters element.
Two levels of alerts can be generated, depending on user-defined values in the Parameters element, including labels for each threshold. Users customizing this type of KPI in the Crosswork Health Insights application user interface can pick labels from a dropdown menu (the choices are MINOR, MAJOR, WARNING, and CRITICAL.). When the data is above the Level 2 threshold, the KPI sends alerts using the Level 2 label. When it is between Level 2 and Level 1, it sends alerts using the Level 1 label. When the data is below Level 1, it will be CLEAR.
Crosswork Health Insights threshold KPIs employ dampening and hysteresis, as illustrated in the figure below. Alerts are generated only when the value is above a threshold for a time interval and are cleared when the value is below a threshold for a defined time interval (known as the clear time). Users can define the clear time by setting the amount of time the value needs to be below the level 1 threshold.
Inside the CPU Threshold KPI
"CPU Threshold" is a stock two-level threshold KPI. This KPI reports data and generates an alert whenever a monitored device's CPU usage crosses a defined threshold value. The alert is cleared whenever the threshold value is below the defined value for the defined time interval given in the Parameters element of the KPI.The following table describes KPI elements “under the hood” of the CPU Threshold KPI and gives examples of the kinds of values these elements contain. KPI execution output has a nested structure, with (for example) many possible “Parameter” elements defined within the “Parameters” element. The table also indicates whether users can modify these elements’ values at runtime, using the Cisco Crosswork Health Insights user interface. Although many are not modifiable at runtime, you can modify many of them if you choose to create a custom KPI using a stock KPI as your template. See the topic Create Custom KPIs From Stock KPIs, where we demonstrate how to change the numerical thresholds for the CPU Threshold KPI.
|
Element |
Value |
Description |
RT Modifiable? |
|
KPI_ID |
pulse_cpu_threshold |
This is the unique name the system uses to identify each KPI. |
No |
|
KPI_Name |
CPU threshold |
The user- or Cisco-defined name of the KPI. This need not be unique, and is the name displayed in the GUI when users select a KPI to run. |
Yes |
|
Category |
CPU |
The KPI category used to group KPIs in the GUI.
|
Yes |
|
Summary |
Monitors CPU usage across route processor and line cards on routers |
A short text description of the KPI’s purpose, usually identifying the overall purpose of the KPI. |
Yes |
|
Details |
Monitors CPU usage across route processor and line cards on routers; generates an alert when CPU utilization exceeds the configured threshold |
A more detailed description of the KPI, usually explaining how it processes the data it is collecting and when it raises alerts. |
Yes |
|
Alert_Outputs |
Producer |
One or more tags defining data items to be extracted from the telemetry stream data and passed along with the alert. In this case, it is the name of the device where the anomaly was detected. Other tags, such as “node-name”, will be determined by the YANG path or SNMP OID. |
No |
|
Paths |
Path |
Container for one or more YANG “Path” elements. Contents of this container are definitions of data collection points.
|
No |
|
Path |
Cisco-IOS-XR-wdsysmon-fd-oper:system-monitoring/cpu-utilization |
The YANG Path representing the device or network-health metric to be tracked and its container. |
No |
|
Cadence |
Default, min, max, increment |
Container defining how often the KPI collects and reports data. All values are assumed to be in minutes (“1” represents 60 seconds).
|
Yes |
|
Default (in Cadence) |
1 |
The default cadence for collecting data. In this case, the default is once every minute. |
Yes |
|
Min (in Cadence) |
1 |
The minimum time to elapse between data collections. In this case, this is also once every minute (60 seconds). |
Yes |
|
Max (in Cadence) |
15 |
The maximum time to elapse between data collections. This can be up to 15 minutes. |
Yes |
|
Increment (in Cadence) |
1 |
How many times to gather data within the default period. In this case, the value represents one data collection. |
Yes |
|
Scripts |
Script |
Contains one or more Script elements. |
|
|
Script |
(autogenerated TICKscript code) |
Each Script element defined under the Scripts element will contain the text of an auto-generated TICKscript that the KPI uses to monitor and evaluate collected data. These are autogenerated by the system and should not be changed. |
|
|
Parameters |
Parameter |
Container for one or more Parameter elements defining how the KPI will execute. In this example, the contents of this container define numerical usage thresholds, the amount of time these thresholds must be exceeded before an alert is generated, the severity labels used in the alerts, and the time that must pass before an of the alerts are cleared.
|
Yes |
|
Parameter |
name, type, value, description, display_name, possible_values |
Container for each parameter’s values. |
No |
|
name (in a Parameter) |
Level 2-severity |
The parameter’s name. In this case, the parameter is defining the severity label to be applied when the KPI detects that the level 2 threshold has been crossed. |
No |
|
type (in a Parameter) |
string |
The class of value for this defined parameter. In this case, it is a text string containing the severity label. If it were defining the threshold level, the type would be “float”, for a floating point number. |
No |
|
value (in a Parameter) |
MAJOR |
The actual parameter value. In this case, it is a text string identifying the alert severity as “MAJOR”. |
Yes |
|
description (in a Parameter) |
Severity label of a level 2 alert |
Text description of the Parameter and what it defines. |
No |
|
display_name (in a Parameter) |
Level 2 Alert Severity
|
The name of the alert as it is displayed on the GUI dashboard. |
No |
|
possible_values (in a Parameter)
|
MINOR, MAJOR, WARNING, CRITICAL
|
The list of other possible values to apply to the alert. These alternatives are presented as drop-down lists at runtime. Although users can select one of these alternatives at runtime, the list itself is fixed. |
Yes |
|
Sensor Type |
YANG_MDT |
An optional element, found in KPIs that use MDT. Indicates that Model Driven Telemetry is being used to track the data. |
Yes |
Create Custom KPIs From Stock KPIs
In addition to creating your own KPIs (see Create a New KPI in the Cisco Crosswork Change Automation and Health Insights User Guide, you can use the Health Insights application and tools of your choice to export a stock KPI, customize it, then import and run it like any other KPI. The steps below use the KPI discussed in Inside the CPU Threshold KPI as an example, demonstrating how you can modify this stock KPI's level 1 and level 2 threshold values to match your needs, then make additional modifications that will allow you to import it back into Crossworks Health Insights.
- Log in to an installed instance of Cisco Crosswork Change Automation and Health Insights and navigate to **Health Insights > Manage KPIs**.
- Select the "CPU Threshold" KPI. Then click **Export** to download it as a gzip archive.
- Un-tar the downloaded gzip archive file using the tool of your choice. For example, using the command line:
tar -xvzf kpis-export-1234567890.tar.gz. In this example, the tar command will unzip the archive to a new export folder, with three subfolders:dashboards,kpis, andticks. - Navigate to the
ticksfolder and open thepulse\_cpu\_threshold\_template.tickscript using the ASCII editor of your choice. - Make the following changes to the ASCII tick script file:
- Find and change the default floating-point values for the two threshold variables
level2\_thresholdandlevel1\_threshold. For example:var level1\_threshold = 60.0var level1\_threshold = 40.0.
- Find and change the values of the ID variables
kpi\_idandalert\_id. For example:var kpi\_id = 'my\_pulse\_cpu\_threshold'var alert\_id = 'my\_pulse\_cpu\_threshold'
- When you are finished, save the changed tick script using a new name. For example:
my\_pulse\_cpu\_threshold\_template.tick.
- Find and change the default floating-point values for the two threshold variables
- Navigate to the
kpisfolder and open thepulse\_cpu\_threshold\_kpi.jsonfile using the JSON editor of your choice. - Make the following changes to the KPI JSON file:
- Find and change the
kpi\_idandscript\_idvariables in the JSON file so that they point to the KPI and script names you just modified. For example:"kpi\_id": "my\_pulse\_cpu\_threshold""script\_id":"my\_pulse\_cpu\_threshold\_template.tick"
- When you are finished, save the modified JSON file with a new name. For example:
my\_pulse\_cpu\_threshold\_kpi.json.
- Find and change the
- Navigate to the
dashboardsfolder and open thePulse-cpu-threshold-raw.jsonandPulse-cpu-threshold-summary.jsonfiles using the JSON editor of your choice. - Make the following changes in both of the dashboard JSON files:
- Find every occurrence of the old
kpi\_idvalue and replace it with the newkpi\_idvalue you created. In this example, you would find every occurrence ofpulse\_cpu\_thresholdand replace it withmy\_pulse\_cpu\_threshold. - When you are finished, save the modified dashboard JSON files using the same file names.
- Find every occurrence of the old
- Compress the modified KPI files into a single gzip archive with a new file name. For example, using the command line:
tar -cvzf kpis-my-cpu-threshold.tar.gz export/. - Log in to Cisco Crosswork Change Automation and Health Insights and navigate to **Health Insights \> Manage KPIs**. Then click **Import** to upload the new KPI you created using the stock KPI as a template.
Health Insights Stock KPIs
The table below lists the stock Health Insights KPIs supplied with Cisco Crosswork Change Automation and Health Insights.
Alerting types in the table that you can select when you create a new KPI using the Health Insights user interface are:
- No Alert : The KPI gathers, tracks and reports performance data without triggering alerts.
- Standard Deviation : The KPI detects spikes or drops in measured values and alerts when these values deviate some number of standard deviations away from their normal values.
- Two-Level Threshold : The KPI detects abnormal measured values using two custom thresholds and the ability to provide dampening intervals on the thresholds.
- Rate Change : The KPI detects abnormal rates of change in measured values to detect rising or falling values.
Additional alerting types that you can use when you export and use stock KPIs to create KPIs with custom parameters are:
- Standard Deviation of Rate Change : The KPI alerts on standard deviations of the rate of change.
- Low Single Threshold : The KPI alerts on a single threshold when the value falls below that threshold.
- Direct Alarm Forwarding : The KPI uses the alarm from the device directly, as a Health Insights KPI alert.
- Major/Minor/Low/High Thresholds : The KPI alerts on Major high, Minor high, Minor low, and Major low values.
- Line State Changes : The KPI alerts on shutdowns and flapping in line states.
| Category | KPI Name | Description | Alerting | MDT or SNMP |
|---|---|---|---|---|
| Dataplane-Counters | CEF drops | Monitors CEF drop counters and baseline. Generates an alert for an unusual number of drops. | Rate Change | MDT |
| CPU | CPU threshold | Monitors CPU usage across route policies and line cards on routers. Generates an alert when CPU utilization exceeds the configured threshold | Two-Level Threshold | MDT |
| CPU | CPU utilization | Monitors CPU usage across route policies and line cards on routers. Generates an alert when CPU utilization is unusual. | Standard Deviation | MDT |
| Basics | Device uptime | Monitors device uptime. | Low Single Threshold | MDT |
| Layer 1-Traffic | Ethernet port error counters | Monitors port transmit and receive error counters. | Rate Change | MDT |
| Layer 1-Traffic | Ethernet port packet size distribution | Monitors port transmit and receive packet size distributions. | No Alert | MDT |
| Layer 1-Traffic | Ethernet port packet statistics | Monitors port transmit and receive packet statistics. | Standard Deviation of Rate Change | MDT |
| Layer 2-Traffic | Interface bandwidth monitor | Monitors bandwidth utilization across all interfaces on a router. Generates an alert when bandwidth exceeds the configured threshold. | Two-Level Threshold | MDT |
| Layer 3-Traffic | Interface counters by protocol | Monitors interface statistics (such as incoming and outgoing packets or byte counters) organized by protocol. | Standard Deviation | MDT |
| Layer2-Interface | Interface flap detection | Monitors interface flaps and alerts when flap count reaches set threshold. | Two-Level Threshold | MDT |
| Layer 2-Traffic | Interface packet counters | Monitors interface transmit and receive counters. Generates an alert when unusual traffic rates occur. | No Alert | MDT |
| Layer 2-Traffic | Interface packet error counters | Monitors interface transmit and receive error counters. Generates an alert when unusual error rates occur. | Rate Change | MDT |
| QOS | Interface QoS (egress) | Monitors interface QoS on the egress direction for queue statistics, queue depth, and so on. | No Alert | MDT |
| QOS | Interface QoS (ingress) | Monitors interface QoS on the ingress direction for queue statistics, queue depth, and so on. | No Alert | MDT |
| Layer 2-Traffic | Interface rate counters | Monitors interface statistics as rate counters. Generates an alert when unusual traffic rates occur. | Standard Deviation | MDT |
| IPSLA | IP SLA UDP echo RTT | Monitors IP SLA UDP echo RTT. Generates an alert when unusual RTT values occur. | Standard Deviation | MDT |
| IPSLA | IP SLA UDP jitter monitoring | Monitors IP SLA UDP jitter. Generates an alert when an abnormal UDP jitter occurs. | Standard Deviation | MDT |
| Layer 3-Routing | IPv6 RIB BGP route count | Monitors IPv6 RIB for route count and memory used by BGP. Generates an alert when an anomaly is detected (such as significant increase or decrease in route counts). | Standard Deviation | MDT |
| Layer 3-Routing | RIB IS-IS route count | Monitors RIB for route count and memory used by IS-IS. Generates an alert when an anomaly is detected (such as significant increase or decrease in route counts). | Standard Deviation | MDT |
| Layer 3-Routing | IPv6 RIB IS-IS route count | Monitors IPv6 RIB for route count and memory used by IS-IS. Generates an alert when an anomaly is detected (such as significant increase or decrease in route counts). | Standard Deviation | MDT |
| Layer 3-Routing | IPv6 RIB OSPF route count | Monitors IPv6 RIB for route count and memory used by OSPF. Generates an alert when an anomaly is detected (such as significant increase or decrease in route counts). | Standard Deviation | MDT |
| Protocol-ISIS | ISIS neighbor summary | Monitors ISIS neighbor summaries for changes in neighbor status. Generates an alert when an anomaly is detected (such as neighbors down or flapping). | Standard Deviation | MDT |
| Layer 1-Optics | Layer 1 optical alarms | Monitors per-port optical alarms (current and past). | Direct Alarm Forwarding | MDT |
| Layer 1-Optics | Layer 1 optical errors | Monitors per-port Layer 1 errors. Generates an alert when error rates exceed the configured threshold. | Rate Change | MDT |
| Layer 1-Optics | Layer 1 optical FEC errors | Monitors per-port optical FEC errors. Generates an alert when FEC errors exceed the configured threshold. | Rate Change | MDT |
| Layer 1-Optics | Layer 1 optical power | Monitors per-port optical power. Generates an alert when power levels exceed the configured threshold. | Major/Minor/Low/High Thresholds | MDT |
| Layer 1-Optics | Layer 1 optical temperature | Monitors per-port optical temperature. Generates an alert when temperature exceeds the configured threshold. | Major/Minor/Low/High Thresholds | MDT |
| Layer 1-Optics | Layer 1 optical voltage | Monitors per-port optical voltage. Generates an alert when voltages exceed the configured threshold. | Major/Minor/Low/High Thresholds | MDT |
| Layer 2-Interface | Line state | Monitors interface line states. Generates an alert when link states change. | Line State Changes | MDT |
| LLDP | LLDP neighbors | Monitors LLDP neighbors. Generates an alert when any sudden changes are detected. | Standard Deviation | MDT |
| Memory | Memory utilization | Monitors memory usage across route processor and line cards on routers. Generates an alert when memory utilization is unusual. | Standard Deviation | MDT |
| Memory | Memory utilization (cXR) | Monitors memory usage across route processor and line cards on classic XR devices. Generates an alert when memory utilization is unusual. | Standard Deviation | MDT |
| Layer 3-Routing | RIB BGP route count | Monitors RIB for route count and memory used by BGP. Generates an alert when an anomaly is detected (such as significant increase or decrease in route counts). | Standard Deviation | MDT |
| Layer 3-Routing | RIB connected route count | Monitors RIB for route count and memory used by connected. Generates an alert when an anomaly is detected (such as significant increase or decrease in route counts). | Standard Deviation | MDT |
| Layer 3-Routing | RIB IS-IS route count | Monitors RIB for route count and memory used by IS-IS. Generates an alert when an anomaly is detected (such as significant increase or decrease in route counts) | Standard Deviation | MDT |
| Layer 3-Routing | RIB local route count | Monitors RIB for route count and memory used by local. Generates an alert when an anomaly is detected (such as significant increase or decrease in route counts). | Standard Deviation | MDT |
| Layer 3-Routing | RIB OSPF route count | Monitors RIB for route count and memory used by OSPF. Generates an alert when an anomaly is detected (such as significant increase or decrease in route counts). | Standard Deviation | MDT |
| Layer 3-Routing | RIB static route count | Monitors RIB for route count and memory used by static. Generates an alert when an anomaly is detected (such as significant increase or decrease in route counts). | Standard Deviation | MDT |
| Layer 3-Routing | RIBv6 connected route count | Monitors RIBv6 for route count and memory used by connected. Generates an alert when an anomaly is detected (such as significant increase or decrease in route counts). | Standard Deviation | MDT |
| Layer 3-Routing | RIBv6 local route count | Monitors RIBv6 for route count and memory used by local. Generates an alert when an anomaly is detected (such as significant increase or decrease in route counts). | Standard Deviation | MDT |
| Layer 3-Routing | RIBv6 static route count | Monitors RIBv6 for route count and memory used by static. Generates an alert when an anomaly is detected (such as significant increase or decrease in route counts). | Standard Deviation | MDT |
| Layer 3-Routing | RIBv6 subscriber route count | Monitors RIBv6 for route count and memory used by subscriber. Generates an alert when an anomaly is detected (such as significant increase or decrease in route counts). | Standard Deviation | MDT |
| Layer 2-Traffic | SNMP interface packet error counters | Monitors interface transmit and receive error counters. Generates an alert when unusual error rates occur. | No Alert | SNMP |
| Layer 2-Traffic | SNMP interface packet counters | Monitors interface transmit and receive counters. Generates an alert when unusual traffic rates occur. | Rate Change | SNMP |
| Layer 2-Traffic | SNMP interface rate counters | Monitors interface statistics as rate counters. Generates an alert when unusual traffic rates occur. | Standard Deviation Rate of Change | SNMP |
| Layer 2-Traffic | SNMP traffic black hole | Monitors input and output data rates for black hole behavior. Checks the ratio of output data rate to input data rate and verifies that the ratio is within acceptable ranges, otherwise a black hole is occurring. | Two-Level Threshold | SNMP |
| Layer 2-Traffic | Traffic black hole | Monitors input and output data rates for black hole behavior. Checks the ratio of output data rate to input data rate and verifies that the ratio is within acceptable ranges, otherwise black hole, | Two-Level Threshold | MDT |