Use Cases
Radius Authentication Summary
The Authentication Summary report is based on the RADIUS authentications. It enables you to identify the most common authentications and the reasons for authentication failures. The report can be accessed in the UI from Operations > Reports > Endpoints and Users > Authentication Summary . It is a combination of several sections, each having reports. The reports cannot be exported individually. The only way to export is to export all the sections together as a pdf. Data Connect gives the user direct access to the Cisco ISE database. As a result, the user can form their own SQL queries to get the specific report that they want and can export the report in any format they like. All the below mentioned reports can be generated from the Data Connect view called radius_authentication_summary.
Click here for the columns-level description of the view radius_authentication_summary.
The Radius Authentication Summary is made up of following sections
- Passed Authentication by Day
- Authentications by Failure reason
- Authentications by Identity Group
- Authentications by Identity Store
- Authentications by ISE Node
- Authentications by Allowed Protocol
- Authentications by Network Device Name
- Authentications by Network Device Type
- Authentications by Location
- Authentications by Security Group
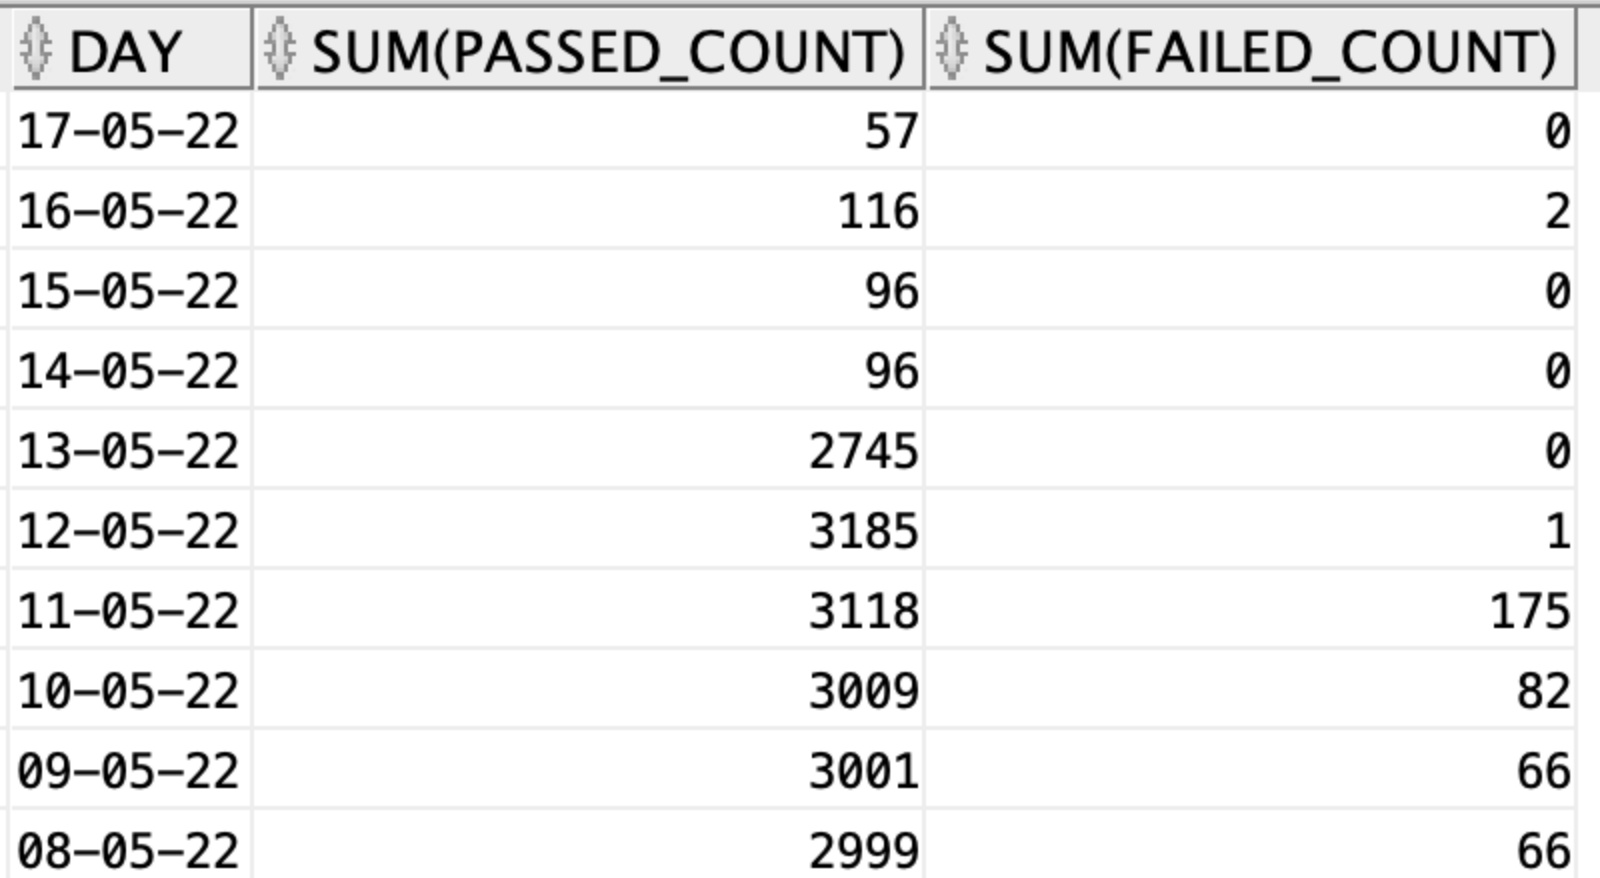
Passed Authentications by Day
In the authentication summary report, the number of Passed Authentications by Day is displayed as a chart and can only be exported as a pdf. This shows daywise number of passed and failed authentications. you can get the data of the chart through Data Connect from the radius_authentication_summary view using the below SQL.
select trunc(timestamp) day, sum(passed_count), sum(failed_count) from radius_authentication_summary group by trunc(timestamp) order by day desc;
EXPLANATION
Here you want to display the number of passed and failed authentications daywise. The timestamp stores not only the date but also the time and timezone. Example timestamp is "03-05-22 2:49:00.000000000 AM". So you use the trunc function to get the date from the timestamp. After that, you sum the passed count and failed count for all the rows with the same date and then, group according to date. Finally, you order based on the date with the latest date on top.
OUTPUT
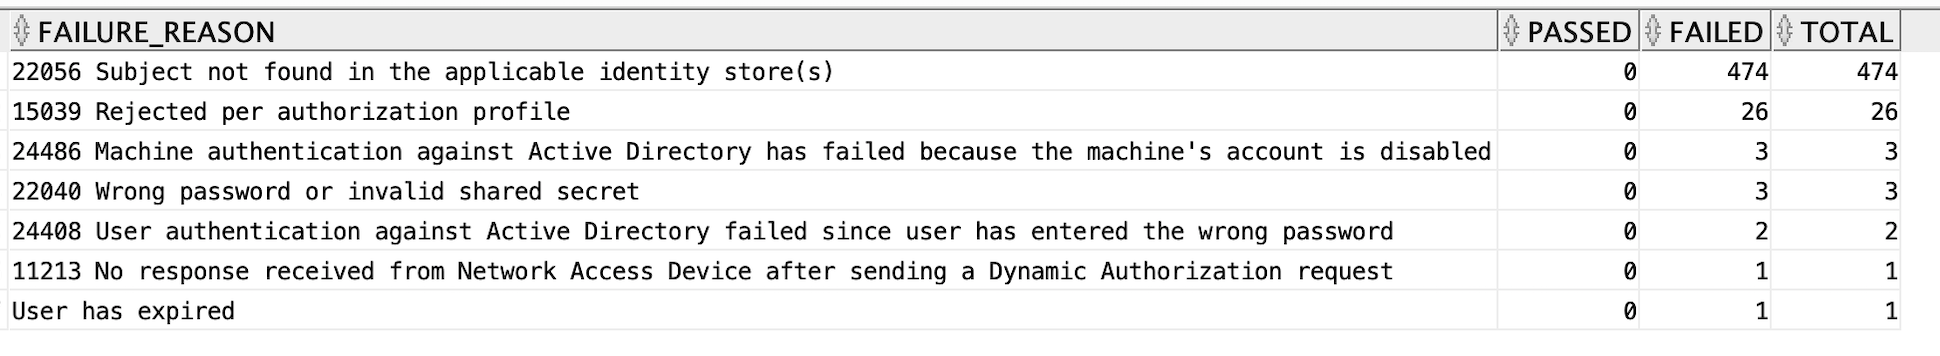
Authentications by Failure reason
In the authentication summary report, the Authentications by Failure reason table shows the reasons for the failure along with total number of authentication failed for each reason. you can use the below SQL in Data Connect to get the same table. you can get the data for the report through Data Connect from the radius_authentication_summary view using the below SQL.
select failure_reason, sum(passed_count) as passed, sum(failed_count) as failed, sum(passed_count) + sum(failed_count) as total from radius_authentication_summary where failure_reason is not null group by failure_reason order by total desc;
EXPLANATION
In the SQL, you are taking sum of passed_count , failed_count and total for all rows that have the same failure reason and then grouping them based on the failure reason. Finally, you sort them in descending order of counts i.e the failure reason with highest count will appear at the top. This way you get the count values for each failure reason.
OUTPUT
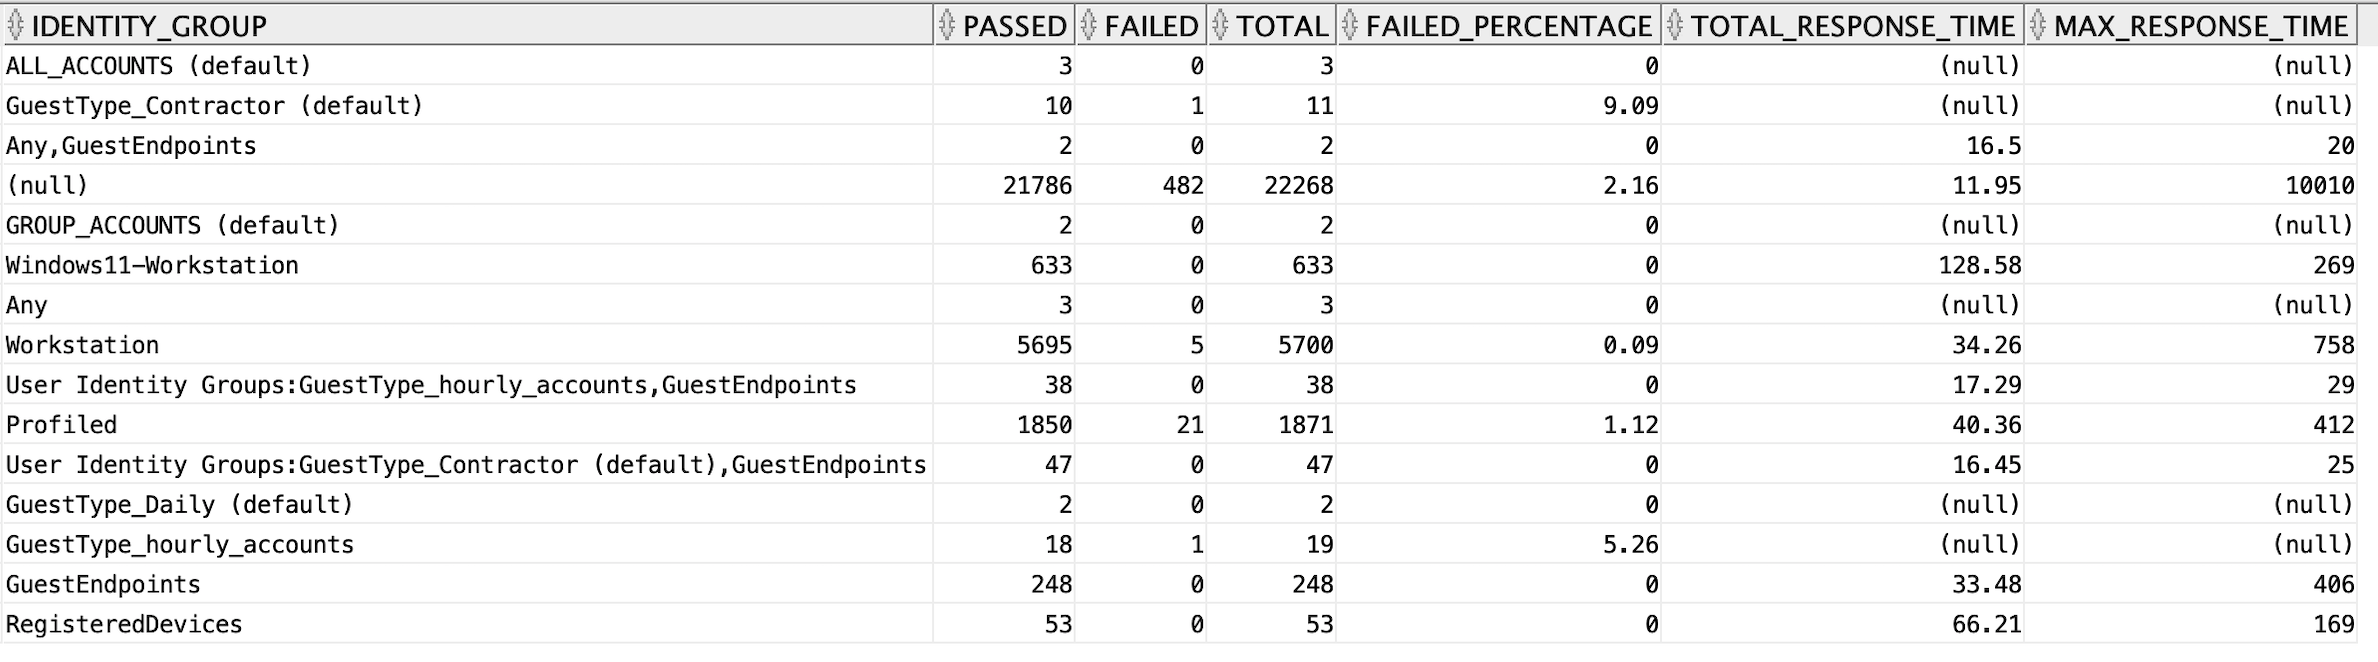
Authentications by Identity Group
In the authentication summary report, the Authenications by Identity Group table shows number of authentications passed, failed, total, failed percentage, avg response time, and peak response time for each of the identity groups. you can get the data for the report through Data Connect from the radius_authentication_summary view using the below SQL.
select identity_group, sum(passed_count) as passed, sum(failed_count) as failed, sum(passed_count) + sum(failed_count) as total, round(to_char(((sum(failed_count) / (sum(passed_count) + sum(failed_count))) * 100)), 2) as failed_percentage, round(to_char(sum(total_response_time)/(sum(passed_count) + sum(failed_count))), 2) as total_response_time, max(max_response_time) as max_response_time from radius_authentication_summary group by identity_group;
EXPLANATION
In the above SQL, you are grouping the data based on the indentity_group column i.e. all the rows which have the same value for the column identity_group will be grouped into one and their passed count, failed count, and total count will be summed and assigned to the group. Similarly the failed percentage, average response time, and max response time will be calculated and assigned for each group.
OUTPUT
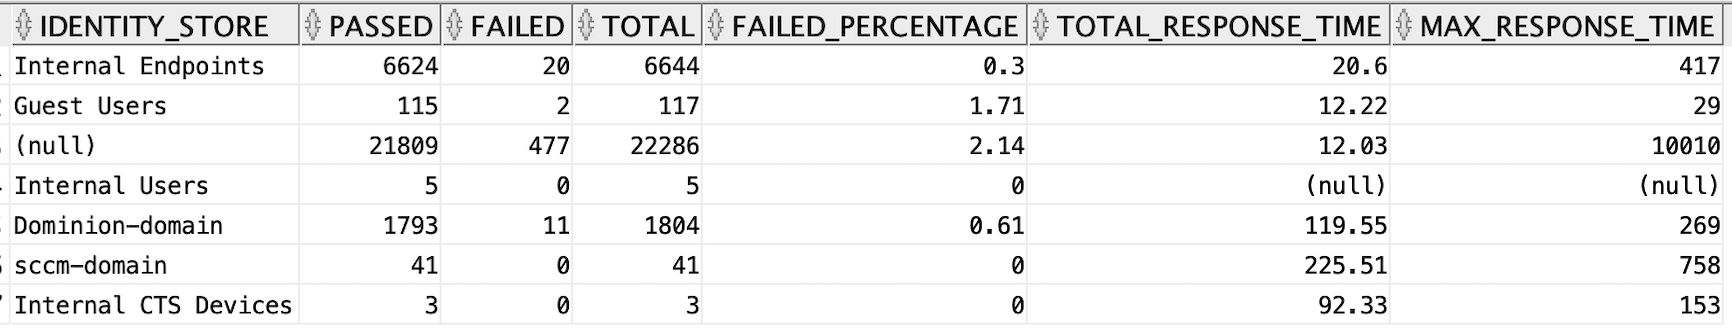
Authentications by Identity Store
In the authentication summary report, the Authentications by Identity Store table shows number of authentications passed, failed, total, failed percentage, avg resposne time, and peak response time for each of the identity stores. you can get the same report through Data Connect from the radius_authentication_summary view using the below SQL.
select identity_store, sum(passed_count) as passed, sum(failed_count) as failed, sum(passed_count) + sum(failed_count) as total, round(to_char(((sum(failed_count) / (sum(passed_count) + sum(failed_count))) * 100)), 2) as failed_percentage, round(to_char(sum(total_response_time)/(sum(passed_count) + sum(failed_count))), 2) as total_response_time, max(max_response_time) as max_response_time from radius_authentication_summary group by identity_store order by total desc;
EXPLANATION
In the above SQL, you are grouping the data based on the identity_store column i.e all the rows which have the same value for the column identity_store will be grouped into one and their passed_count, failed_count, and total values will be summed and assigned to the group. Similarly the failed percentage, average response time, and max response time will be calculated and assigned for each group.
OUTPUT
Authentications by ISE Node
In the authentication summary report, the Authentications by ISE Node table shows number of authentications passed, failed, total, failed percentage, avg response time, and peak response time for each of the Cisco ISE nodes i.e the details of how the AAA server is performing. you can get the same report through Data Connect from the radius_authentication_summary view using the below SQL.
select ise_node, sum(passed_count) as passed, sum(failed_count) as failed, sum(passed_count) + sum(failed_count) as total,round(to_char(((sum(failed_count) / (sum(passed_count) + sum(failed_count))) * 100)), 2) as failed_percentage, round(to_char(sum(total_response_time)/(sum(passed_count) + sum(failed_count))), 2) as total_response_time, max(max_response_time) as max_response_time from radius_authentication_summary group by ise_node;
EXPLANATION
In the above SQL, you are grouping the data based on the ISE_NODE column i.e all the rows which have the same value for the column ISE_NODE will be grouped into one and their passed_count, failed_count, and total values will be summed and assigned to the group. Similarly the failed percentage, average response time, and max response time will be calculated and assigned for each group.
OUTPUT

Authentications by Allowed Protocol
In the authentication summary report, the Authentications by Allowed Protocol table shows number of authentications passed, failed, total, failed percentage, avg response time, and peak response time for each of the allowed protocols (access_service) i.e the details of how each allowed protocol is working. you can get the same report through Data Connect from the radius_authentication_summary view using the below SQL.
select access_service as allowed_protocol, sum(passed_count) as passed, sum(failed_count) as failed, sum(passed_count) + sum(failed_count) as total, round(to_char(((sum(failed_count) / (sum(passed_count) + sum(failed_count))) * 100)), 2) as failed_percentage, round(to_char(sum(total_response_time)/(sum(passed_count) + sum(failed_count))), 2) as total_response_time, max(max_response_time) as max_response_time from radius_authentication_summary group by access_service;
EXPLANATION
In the above SQL, you are grouping the data based on the access_service (Allowed Protocol) column i.e all the rows which have the same value for the column access_service will be grouped into one and their passed_count, failed_count, and total values will be summed and assigned to the group. Similarly the failed percentage, average response time, and max response time will be calculated and assigned for each group of access_service (Allowed Protocol).
OUTPUT

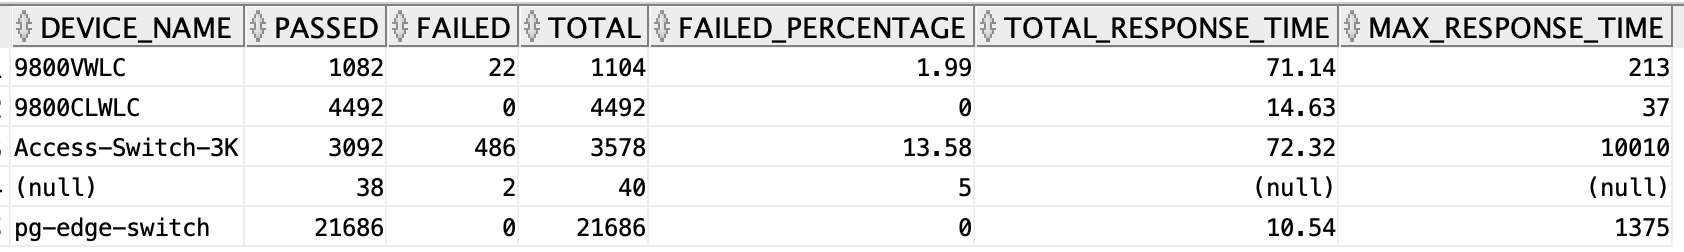
Authentications by Network Device Name
In the authentication summary report, the Authentications by Network Device Name table shows number of authentications passed, failed, total, failed percentage, avg response time, and peak response time for each of the Networks Device Name i.e the performance details of authentications through each Network Device. you can get the same report through Data Connect from the radius_authentication_summary view using the below SQL.
select device_name as network_device_name, sum(passed_count) as passed, sum(failed_count) as failed, sum(passed_count) + sum(failed_count) as total, round(to_char(((sum(failed_count) / (sum(passed_count) + sum(failed_count))) * 100)), 2) as failed_percentage, round(to_char(sum(total_response_time)/(sum(passed_count) + sum(failed_count))), 2) as total_response_time, max(max_response_time) as max_response_time from radius_authentication_summary group by device_name;
EXPLANATION
In the above SQL, you are grouping the data based on the device_name column i.e all the rows which have the same value for the column device_name will be grouped into one and their passed_count, failed_count, and total values will be summed and assigned to the group. Similarly the failed percentage, average response time, and max response time will be calculated and assigned for each group of Device name.
OUTPUT
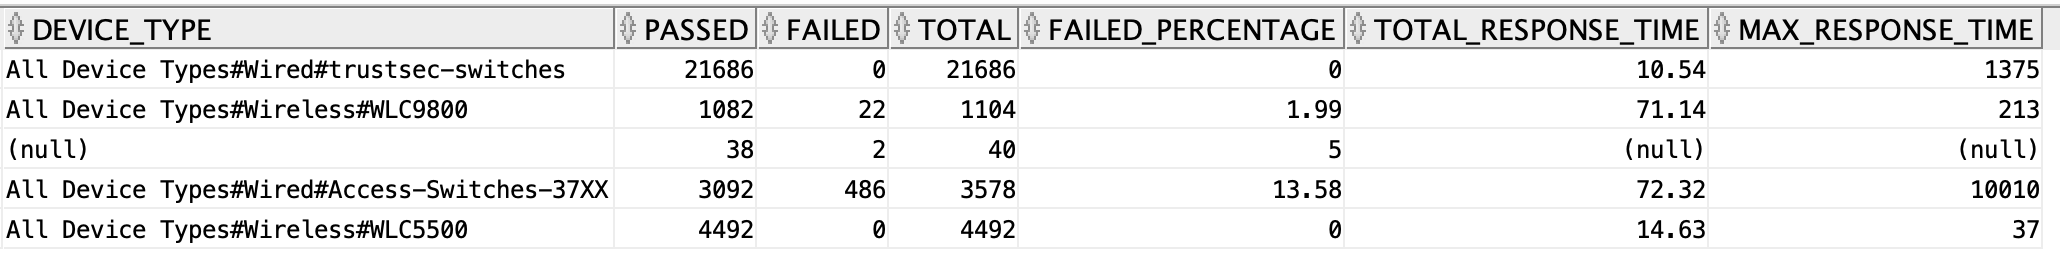
Authentications by Network Device Type
In the authentication summary report, the Authentications by Network Device Type table shows number of authentications passed, failed, total, failed percentage, avg response time, and peak response time for each kind of Network Device Type i.e the performance details of authentications though different types of network device. you can get the same report through Data Connect from the radius_authentication_summary view using the below SQL.
select device_type, sum(passed_count) as passed, sum(failed_count) as failed, sum(passed_count) + sum(failed_count) as total, round(to_char(((sum(failed_count) / (sum(passed_count) + sum(failed_count))) * 100)), 2) as failed_percentage, round(to_char(sum(total_response_time)/(sum(passed_count) + sum(failed_count))), 2) as total_response_time, max(max_response_time) as max_response_time from radius_authentication_summary group by device_type;
EXPLANATION
In the above SQL, you are grouping the data based on the device_type column i.e all the rows which have the same value for the column device_type will be grouped into one and their passed_count, failed_count, and total values will be summed and assigned to the group. Similarly the failed percentage, average response time, and max response time will be calculated and assigned for each group of Device Type.
OUTPUT
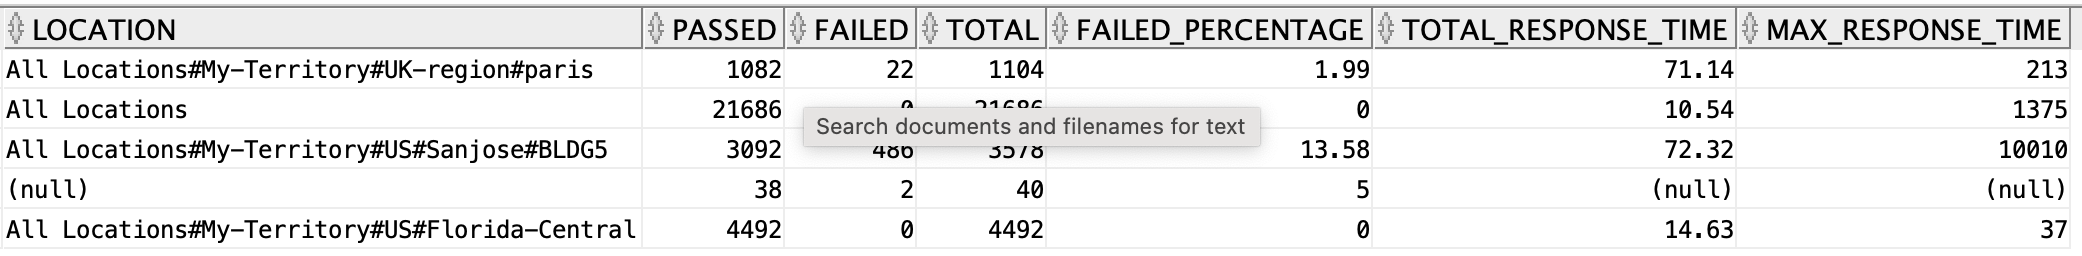
Authentications by Location
In the authentication summary report, the Authentications by Location table shows number of authentications passed, failed, total, failed percentage, avg response time, and peak response time for each location i.e the performance details of authentications locationwise. you can get the same report through Data Connect from the radius_authentication_summary view using the below SQL.
select location, sum(passed_count) as passed, sum(failed_count) as failed, sum(passed_count) + sum(failed_count) as total, round(to_char(((sum(failed_count) / (sum(passed_count) + sum(failed_count))) * 100)), 2) as failed_percentage, round(to_char(sum(total_response_time)/(sum(passed_count) + sum(failed_count))), 2) as total_response_time, max(max_response_time) as max_response_time from radius_authentication_summary group by location;
EXPLANATION
In the above SQL, you are grouping the data based on the location column i.e all the rows which have the same value for the column location will be grouped into one and their passed_count, failed_count, and total values will be summed and assigned to the group. Similarly the failed percentage, average response time, and max response time will be calculated and assigned for each location.
OUTPUT
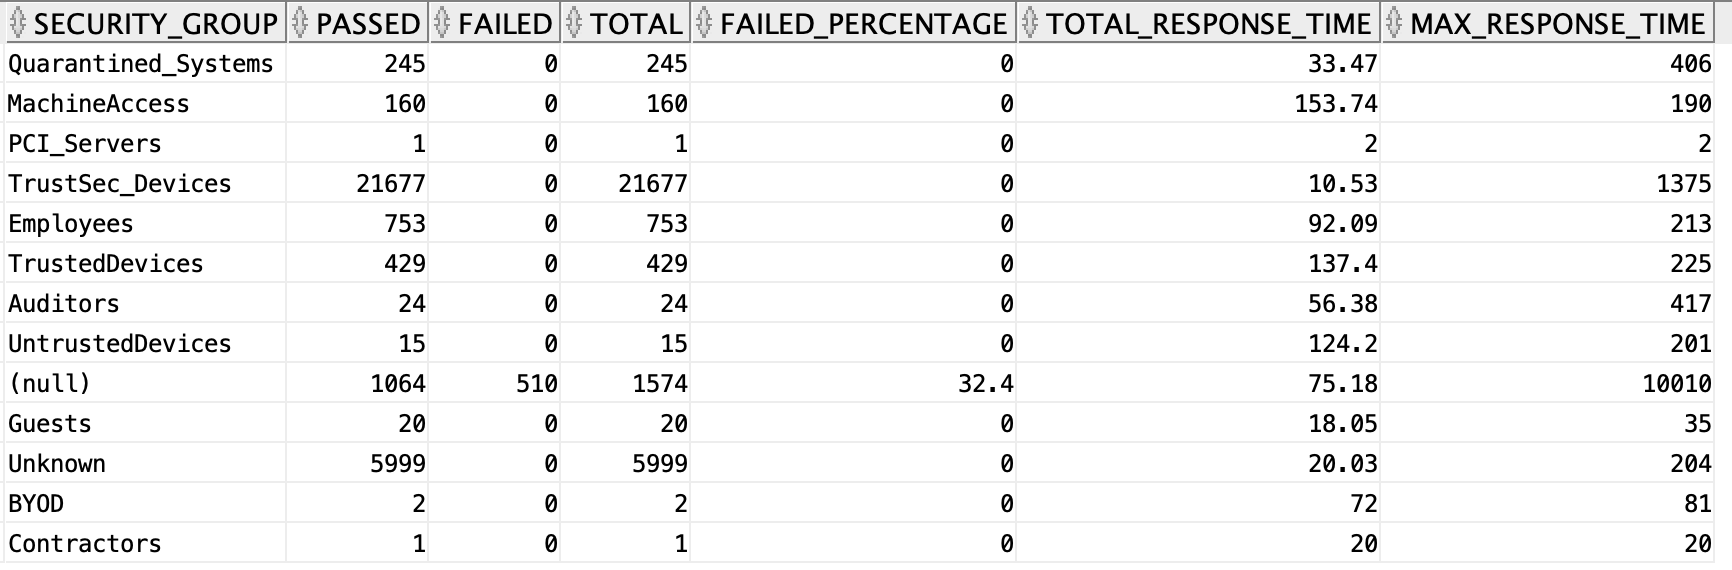
Authentications by Security Group
In the authentication summary report, the Authentications by Security Group table shows number of authentications passed, failed, total, failed percentage, avg response time, and peak response time for each SGT i.e the performance details of authentications SGTwise. you can get the same report through Data Connect from the radius_authentication_summary view using the below SQL.
select security_group, sum(passed_count) as passed, sum(failed_count) as failed, sum(passed_count) + sum(failed_count) as total,round(to_char(((sum(failed_count) / (sum(passed_count) + sum(failed_count))) * 100)), 2) as failed_percentage, round(to_char(sum(total_response_time)/(sum(passed_count) + sum(failed_count))), 2) as total_response_time, max(max_response_time) as max_response_time from radius_authentication_summary group by security_group;
EXPLANATION
In the above SQL, you are grouping the data based on the security_group column i.e all the rows which have the same value for the column security_group will be grouped into one and their passed_count, failed_count, and total values will be summed and assigned to the group. Similarly the failed percentage, average response time, and max response time will be calculated and assigned for each security_group.
OUTPUT
ER Diagram Examples
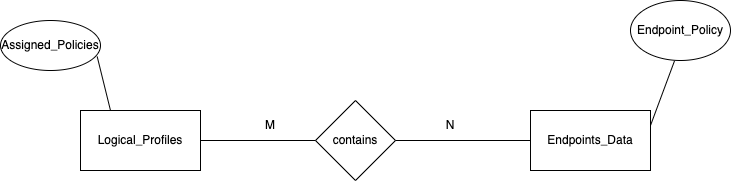
Logical Profiles and Endpoints Data
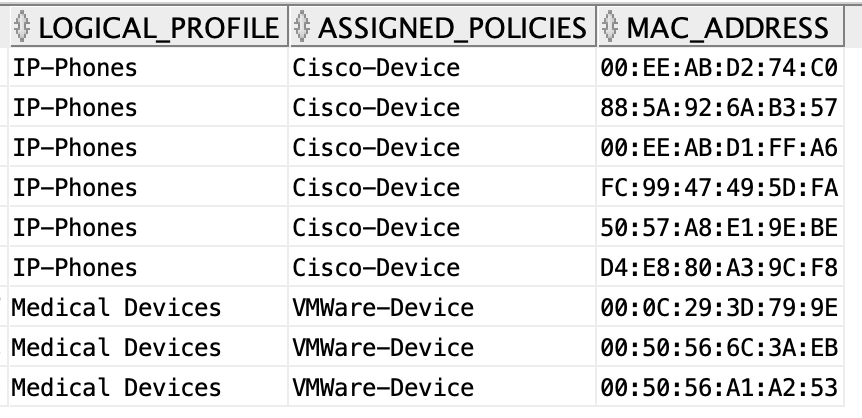
Logical profiles provide a method to group any number of endpoint profiles. Similarly, an endpoint profile can be a member of more than one logical profile. The ER diagram represents the two views and shows the attributes that will be used for joining. In this example you join the logical_profiles and endpoints_data views to get the details of all endpoint devices that belong to logical profiles. In the logical profiles view assigned_policies represent the endpoint profiles and in endpoints_data view it is represented by endpoint_policy. Here you use these two fields to join the table to get the desired result.
select b.logical_profile, b.assigned_policies ,a.mac_address from endpoints_data a, logical_profiles b where a.endpoint_policy=b.assigned_policies;
OUTPUT
Profiling
Cisco ISE Profiling Services provides dynamic detection and classification of endpoints connected to the network. ISE collects various attributes for each network endpoint to build a profiling database. Through dataconnect this database can be queried to build custom reports. Below are some examples.
- Number of Profiled Endpoints filtered by Endpoint Profile
- Number of different endpoint profiles profiled per endpoint sources
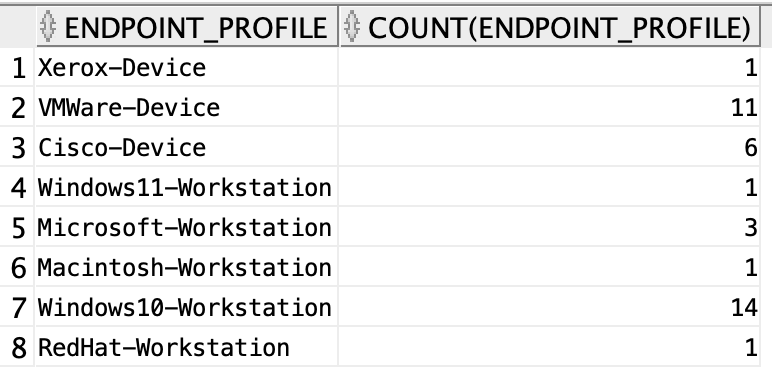
Number of Profiled Endpoints filtered by Endpoint Profile
The below SQL shows the number of endpoints for each endpoint profile.
select endpoint_profile, count(endpoint_profile) from profiled_endpoints_summary group by endpoint_profile;
EXPLANATION
In the SQL above, the records are grouped based on “endpoint_profile” and then for each group we count the number of same records in each group. Thus giving us the required count of records for each “endpoint_profile”.
OUTPUT
Number of different endpoint profiles profiled per endpoint sources
The below SQL shows the number of endpoints under different endpoint profiles profiled from different endpoint sources. In order for the query to work mention all the endpoint profiles used.
select * from ( select source, endpoint_profile from profiled_endpoints_summary) pivot ( count(endpoint_profile) for endpoint_profile in ('Cisco-Device','Macintosh-Workstation', 'Microsoft-Workstation', 'RedHat-Workstation', 'VMWare-Device', 'Windows10-Workstation', 'Windows11-Workstation' , 'Xerox-Device' ));
EXPLANATION
In the above SQL , the pivot function is used, it helps in writing cross tabulation queries. So, records gets grouped by source and endpoint_profile which has several values 'Cisco-Device','Macintosh-Workstation', 'Microsoft-Workstation', 'RedHat-Workstation', 'VMWare-Device', 'Windows10-Workstation', 'Windows11-Workstation' , 'Xerox-Device', each get converted into different columns and the respective aggregate value for count gets stored for each group. Similar to one-hot encoding.
OUTPUT

Posture
Example for retrieving custom posture reposts using SQL through dataconnect.
- Number of Compliant Devices per day
- Number of Non Complaint Devices per Day
- Non Complaint Users with Date
- Details of non-compliant posture
- Number of times a user becomes compliant and non-compliant
Number of Compliant Devices per day
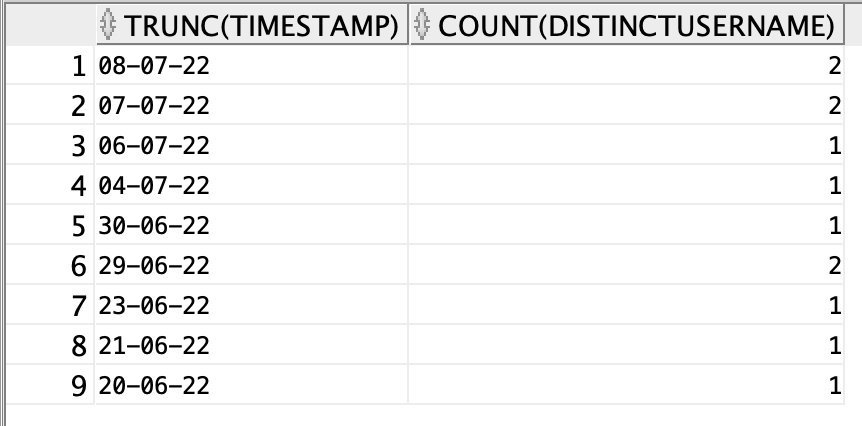
The below SQL shows the number of compliant devices day wise.
select trunc(timestamp) , count(distinct username) from Posture_assessment_by_endpoint where posture_status = 'Compliant' group by trunc(timestamp) order by trunc(timestamp) desc;
EXPLANATION
In the above SQL ,initially the records from Posture assessment by endpoint view that are in compliant state are retrieved. After that the retrieved data is grouped and ordered based on timestamp. “trunc” function gives only the date from the stored timestamp.
OUTPUT
Number of Non Complaint Devices per Day
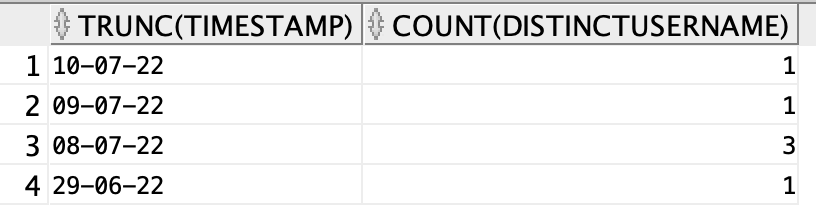
The below SQL shows the number of non-compliant devices day wise
select trunc(timestamp) , count(distinct username) from Posture_assessment_by_endpoint where posture_status = 'NonCompliant' group by trunc(timestamp) order by trunc(timestamp) desc;
EXPLANATION
In the above SQL ,initially the records from Posture assessment by endpoint view that are in non-compliant state are retrieved. After that the retrieved data is grouped and ordered based on timestamp. “trunc” function gives only the date from the stored timestamp.
OUTPUT
Non Complaint Users with Date
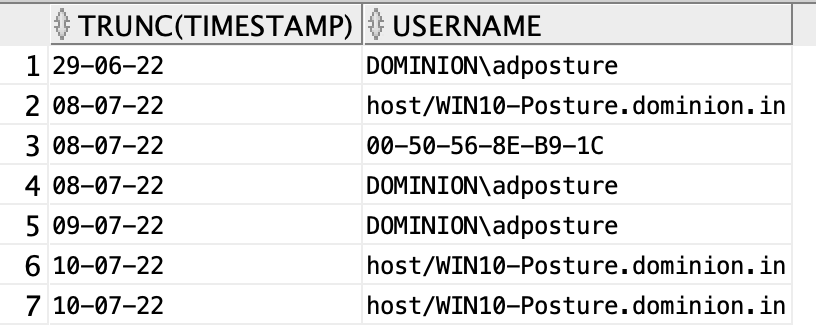
The below SQL will display the usernames of all the non-compliant users along with the date.
select trunc(timestamp), username from Posture_assessment_by_endpoint where posture_status='NonCompliant';
EXPLANATION
In the above SQL, records from Posture Assessment by endpoint view that are in non-compliant state are retrieved. Truncated timestamp i.e. date and the username is displayed from the retrieved records
OUTPUT
Details of non-compliant posture
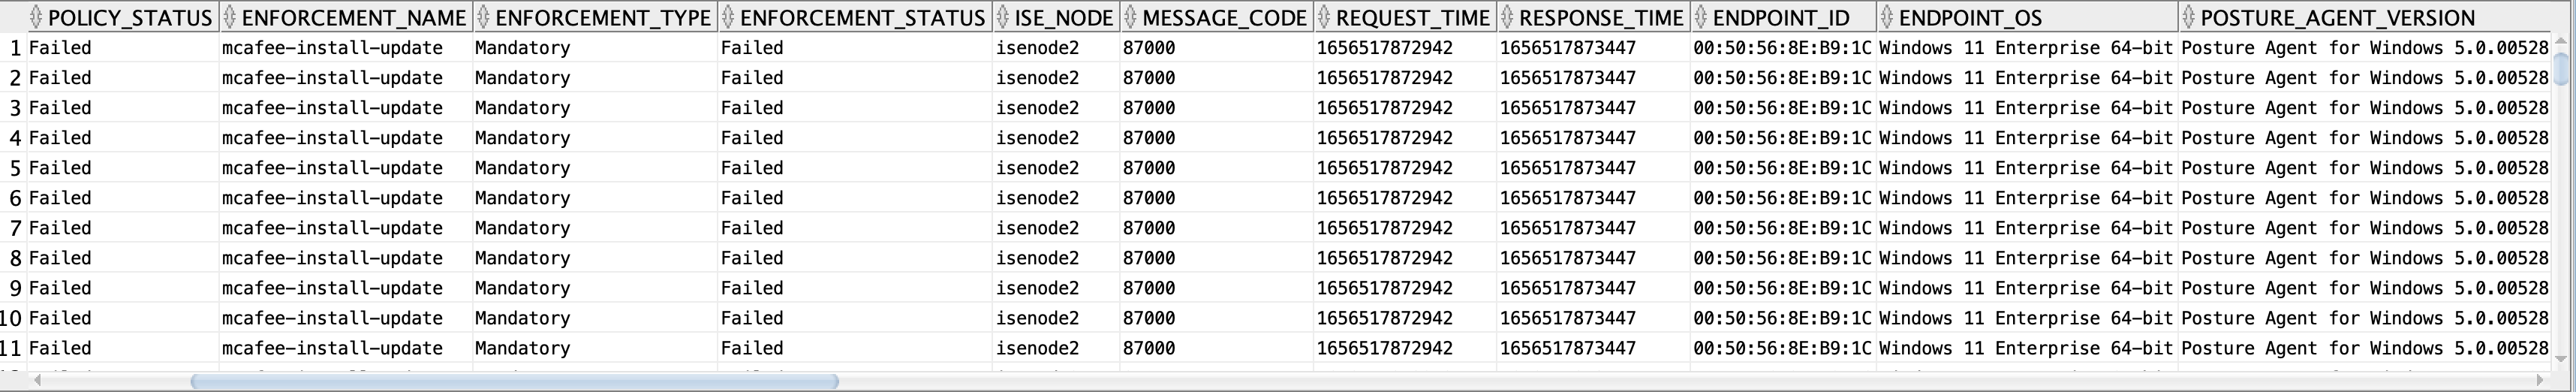
The below SQL will give you all the details of the non-compliant posture including the failure condition.
select * from posture_assessment_by_condition where enforcement_type = 'Mandatory' and posture_status = 'NonCompliant' and Policy_status = 'Failed';
EXPLANATION
In the above SQL, records from Posture Assessment by condition view are retrieved for whom the “enforcement_type” is mandatory , posture status is non-compliant and policy status has failed.
OUTPUT
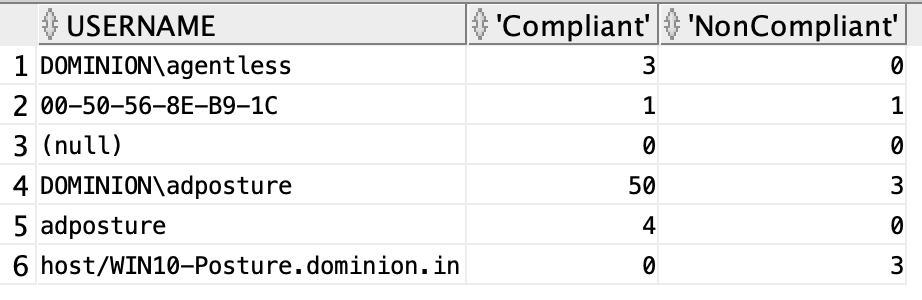
Number of times a user becomes compliant and non-compliant
The below SQL will show the number of times a user was marked compliant and non-compliant.
select * from (select username, posture_status from posture_assessment_by_endpoint ) pivot ( count(posture_status) for posture_status in ('Compliant', 'NonCompliant'));
EXPLANATION
In the above SQL, the pivot function is used, it helps in writing cross tabulation queries. So, records gets grouped by username and “posture_status” which has values for compliant and non-complaint, gets converted into two separate columns complaint and non-complaint and the respective aggregate values for count gets stored for each group. Similar to one-hot encoding
OUTPUT