Dashboard
Alert: Cisco has made the end-of-life (EOL) announcement for the Cisco Edge Intelligence.
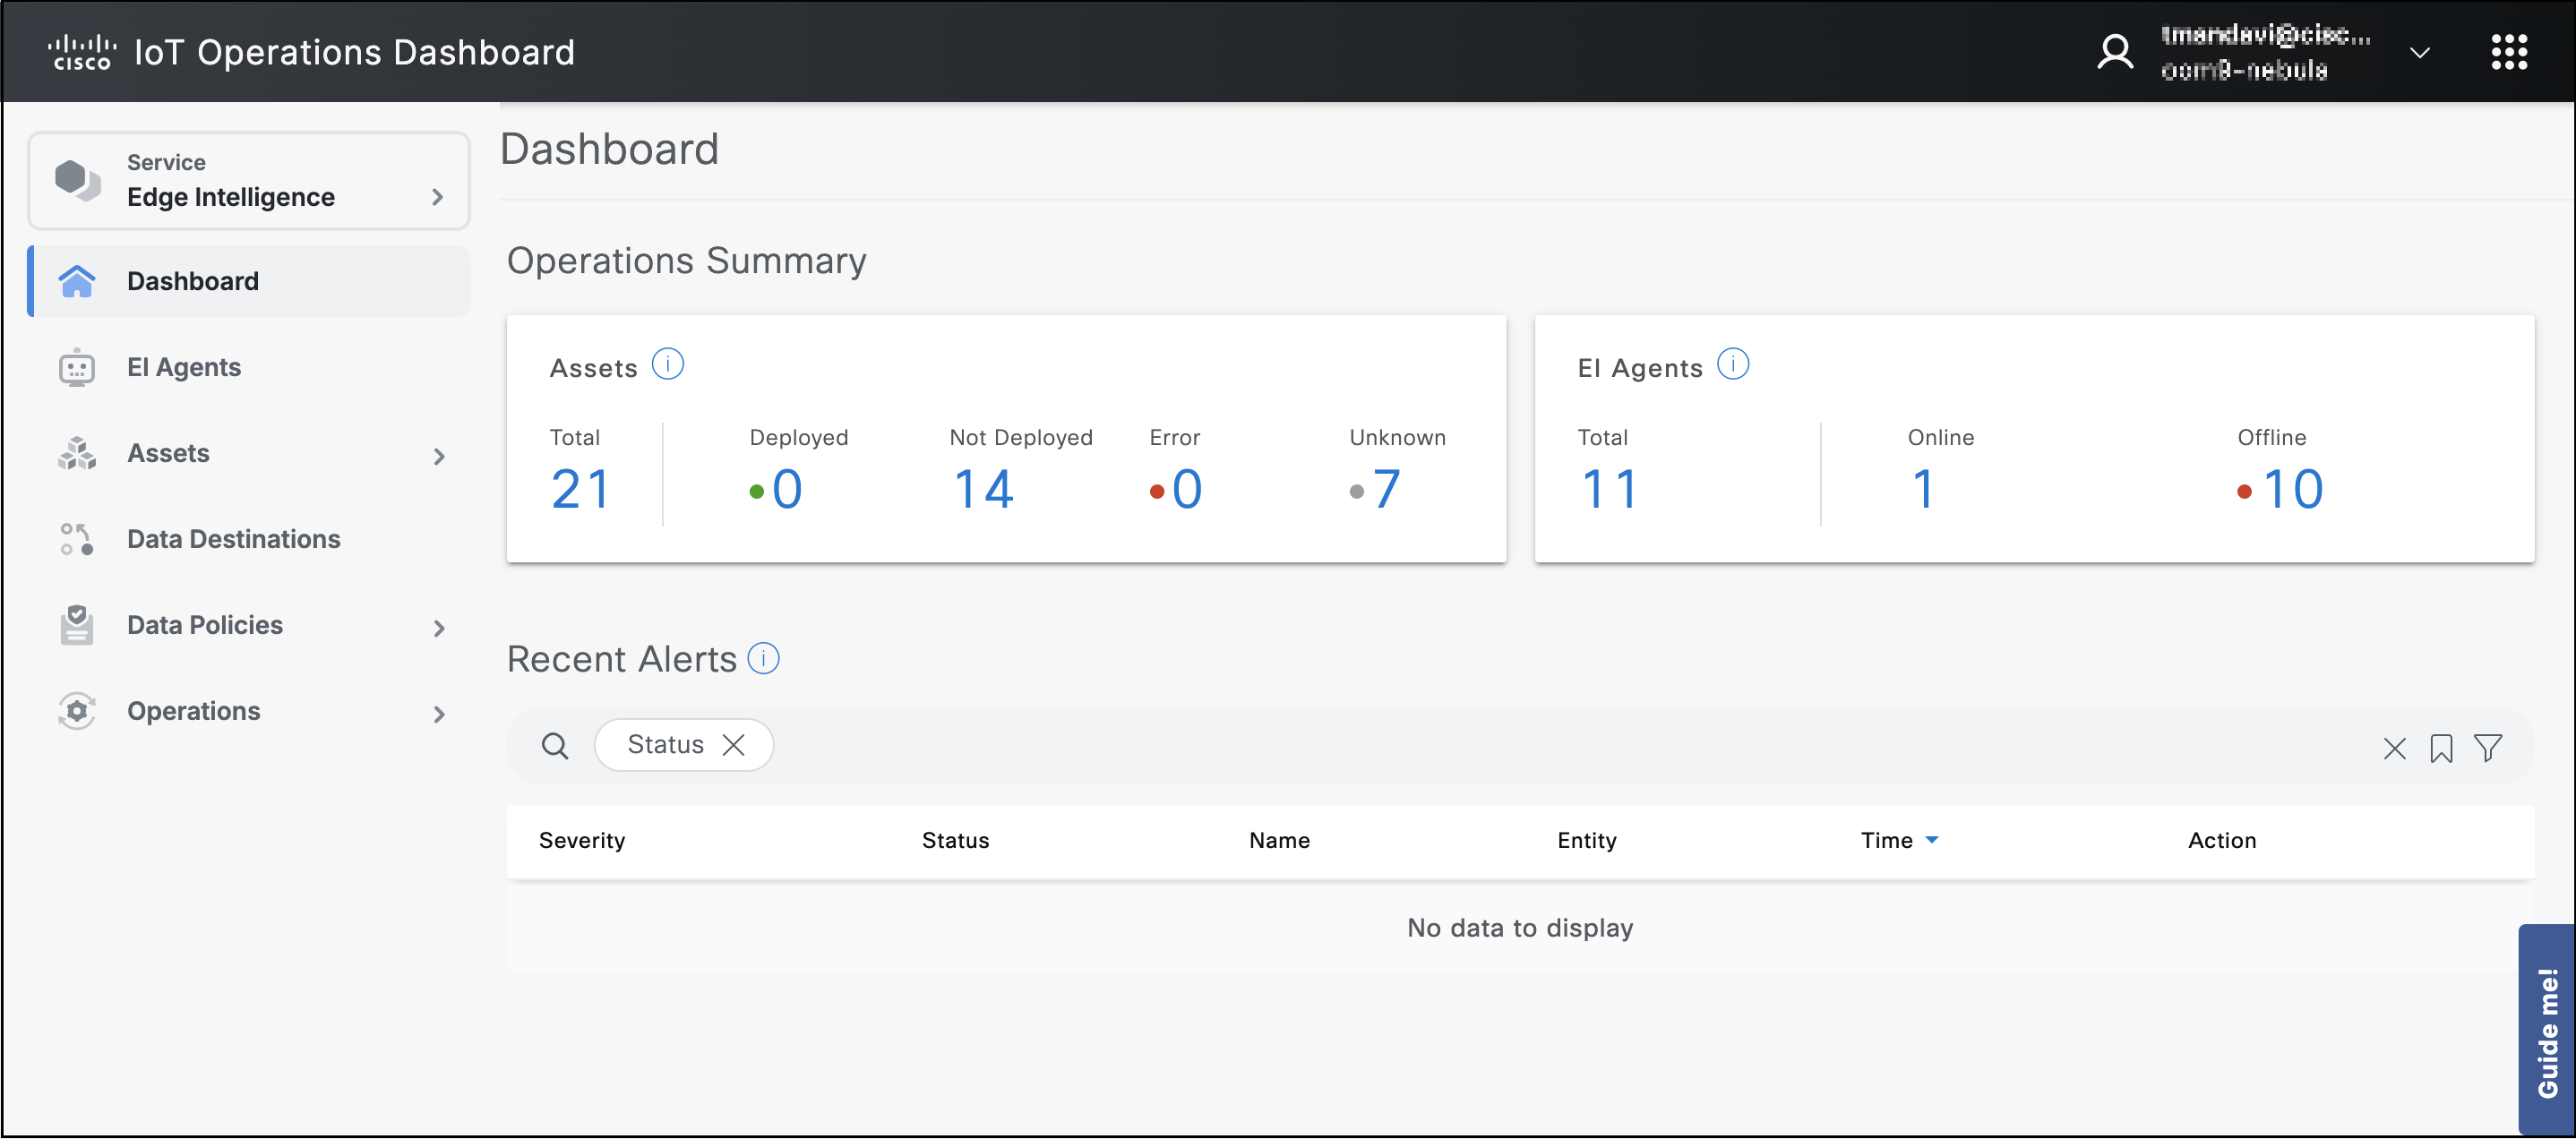
The dashboard displays the unified health information for EI end-to-end data policy and relative metrics that can be used for troubleshooting of the end-to-end policy.
The dashboard also displays EI Agent connectivity, asset connectivity and EI data policy deployment status. Each section displays an information icon which gives some more details about the statistics displayed.