Alert: Cisco has made the end-of-life (EOL) announcement for the Cisco Industrial Asset Vision (IAV).
RF Performance Tool is a feature that allows users to find the potential coverage range of a deployment using a Field Test Device (Adeunis FTD).
Note: This feature is available to select EFT customers by request. Please contact your Cisco support representative for assistance.
Field Test Devices can be added in one of the following two ways:
- If there are no existing Field Test Devices in the system:
- From the left pane, click Maintain > RF Performance Tool.
- In the right pane, click Add Field Test Device.
- If there are existing Field Test Devices in the system and you want to add additional devices:
From the left pane, click Inventory > Sensors.
In the right pane, click Actions > Add Field Test Device.
Complete the following fields and click Add.Field Description Manufacturer Select Adeunis from the drop-down list. Model Select a sensor model from the drop-down list. Region Select a region from the drop-down list. For example, EU868. DevEUI Enter the 16-digit unique ID of the sensor. LoRa Version Select a version from the drop-down list. For example, 1.0.2. Network Key This is not required. You can leave this blank. AppKey Enter the AES 128 bit secret key provisioned on the Field Test Device.
A new Field Test Device is created and listed in the Sensors list. To view the device details, click on the newly created Field Test Device. This process is similar to viewing Sensors. For more information, see View Sensor Details and Troubleshoot.
- After provisioning the Field Test Devices, use them to take measurements at various points of interest. This data is automatically sent to the IAV solution. Every time a new Join Sequence is recorded, it is treated as the start of a new session or dataset.
- After launching, from the left pane, click Maintain > RF Performance Tool. The Field Test Device details are shown.
- Select a device from the Choose Field Test Device drop-down list.
- Click on the time range to set a range. It is by default set to Today.
- Click on the Data Filter drop-down list. The lists of available devices and datasets are shown according to the selected date range. Select one or more Network Devices and/or Datasets under Choose Network Devices and Choose Datasets sections respectively. Click Apply.
- Select Show Data Point / Network Device Correlation to see the relation between the IXM and the data point.
Note: The location of the data point on the map is determined by the GPS location sent by the Adeunis Field Test device. When data is received by more than one IXM, then, the line drawn between the data point and IXM is based on the IXM that had the best-received signal strength.
- Select Show Network Device Name on Map to see the device name.
- Select Show Missed Frames to see the missed uplinks from the sensor. These are represented by gray dots on the map between 2 data points. If the very first or the last uplink is missed, then it won't be shown on the map.
- In the Choose Plotted Data drop-down list, select an option from RSSI, SNR, SF, and Number of Gateways. By default, RSSI is selected. Every one of these options shows a different legend on the right-hand side of the map and the data rendered on the Map View is based on these legends. The data points on the map are connected to the network devices that are chosen in the Data Filter.
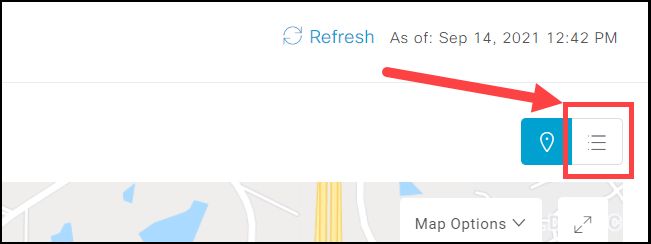
- To view the Field Test Device details in the tabular form, click
 on the top right corner of the page. Only the devices that are chosen in the Data Filter field are shown in the table.
| Column Header | Decription |
|---|---|
| Message Received | The time when the uplink message was received from the device |
| Frame Counter | The frame counter value present in the uplink message |
| Coordinates | The latitude/longitude coordinates. These will be present if they are sent by the sensor in the uplink message. If the sensor is indoors or not able to get a GPS fix, these values will be empty. |
| Best Network Device | In case multiple IXMs get the message, then this field will indicate the IXM which receives the best signal strength. |
| RSSI | This value is sent by the device. It is short for Received Signal Strength Indicator. It is measured in dBm and has a negative value. A value closer to 0 indicates that the signal is better. |
| SNR | This value is sent by the device. It is the Signal to Noise Ratio. It is measured in dB and is the ratio between the received power signal and noise floor power level. A value greater than 0 indicates that the received signal operates above the noise floor. |
| Actual SF | This is the Spreading Factor used by the sensor for the uplink. |
| Number of Network Devices | The number of network devices (IXM) that have received the signal from the sensor. |