Network devices details and troubleshoot
Alert: Cisco has made the end-of-life (EOL) announcement for the Cisco Industrial Asset Vision (IAV).
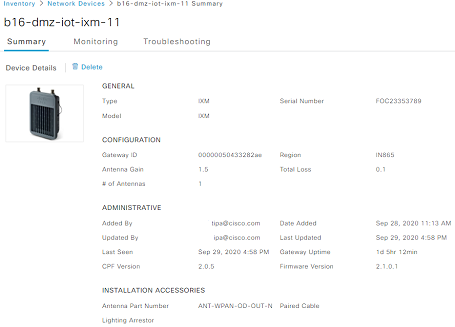
Network device summary
Click on any network device to view its summary. You will be redirected to the network device details summary page.
A network device can be added to an organization hierarchy only if it is onboarded. In the summary page, click Edit Network Device. In the Organization Hierarchy field, click Click to assign to add a level to the asset. Select a level from the Assign Org Hierarchy list. Click  to expand the hierarchy and
  to collapse the hierarchy. You can also search for the level in the Find Hierarchy search field above the hierarchy. Start typing to narrow down the search. Click Assign. In the Edit Network Device page, click Update.
Edit a Network Device
- From the network device summary page, click Edit Network Device.
- Modify the required fields and click Update.
Monitoring network device
A network device can be monitored by viewing its message received and transmitted data periodically.
- Select the time period for viewing monitoring data.
Notes:
- The data is aggregated on an hourly basis if the selected time duration is one day.
- The data is aggregated on a six-hourly basis if the selected time duration is more than a day but less than a week.
- The data is aggregated on a daily basis if the selected time duration is more than a week.
- Two sections of bar graphs are as follows:
Messages Received section shows the bar graphs for total messages received vs the messages received with an OK status.
Ok status: The messages that have passed the Cyclic Redundancy Check (CRC) / messages that have no corrupted data.
Messages Transmitted section shows the bar graphs for total messages in the transmission queue vs the messages transmitted by the network device.
Troubleshooting
This tab shows the topological view of the network for all the network devices that have a status other than Inventory and Unheard.

- Hovering over each network element shows its connectivity status and the last seen timestamp.
- Hover over the connecting line between the operations center and the network devices. It shows the current status and last seen timestamp of the network management and the LoRaWAN.
- A blue line indicates connection status is fine.
- A red line indicates that either the status is offline or unhealthy.
- A blue line indicates connection status is fine.
- Hovering over the network device shows the Radio status, the timestamp when the last message was received from the network device, and the number of uplinks in the past one hour.
- If the network device shows a red indicator, it means the device is offline. The green indicator shows that the device is online.
- The dotted line between the sensor and the network device shows the timestamp when the last signal was received from any of the multiple sensors.
- Click Troubleshoot Now to to view the troubleshooting results for connectivity status for Network management, LoRaWAN network server, network device health, network device radio status, count of messages received by the device in the past hour.
- Click Launch Network Manager to go to the Edge Device Manager Service.
Move Org Hierarchy
- From the left pane click Inventory > Network Devices > select one or more network devices to move to a different level.
- Click Actions > Move Org Hierarchy.
- Select a level from the Assign Org Hierarchy list. Click to expand the hierarchy and to collapse the hierarchy. You can also search for the level in the Find Hierarchy search field above the hierarchy. Start typing to narrow down the search. Click Assign.