Streaming Telemetry
The Current Dilemma
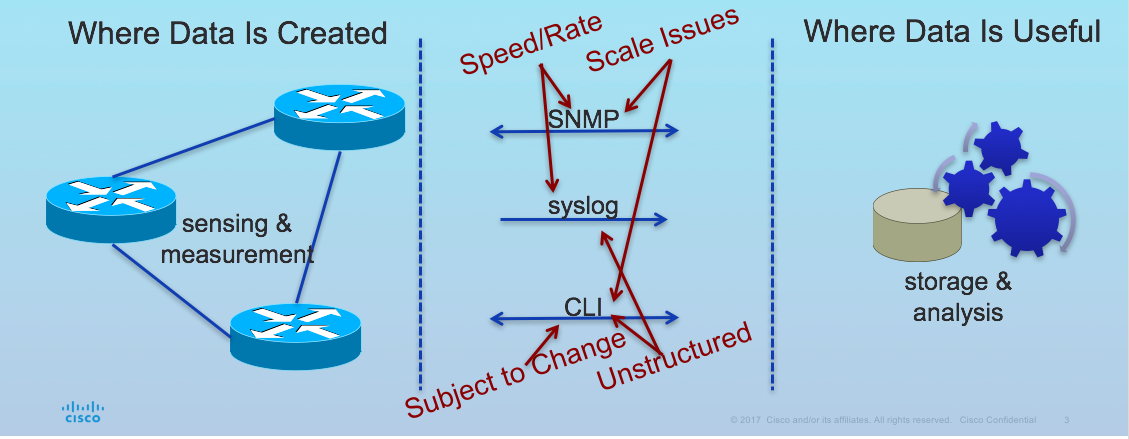
The demand for data regarding network state, whether to detect hot spots in the network, or to aid decision making on workload placement requires data at a cadence that traditional methods just can not deliver. SNMP, CLI and Syslog have limitations that restrict automation and scale.
SNMP polling can often be in the order of 5-10 minutes, CLIs are unstructured and prone to change which can often break scripts.
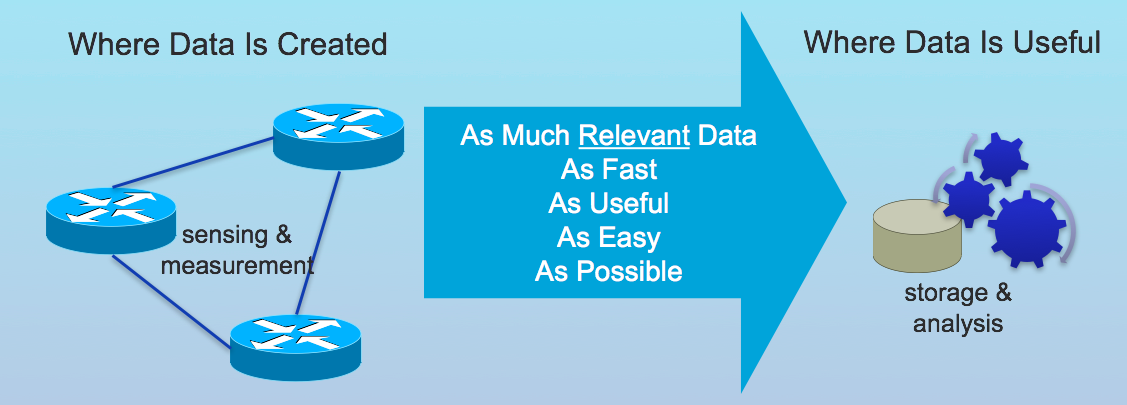
The traditional use of the pull model, where the client requests data from the network does not scale when what you want is near real-time data.
The Solution: Streaming Telemetry
Cisco NXOS streaming telemetry allows us to push data off of the device to a defined endpoint as JSON or using Google Protocol Buffers (GPB) at a much higher frequency and more efficiently.
3 simple steps are all that is required to configure telemetry.
- The is first step is to set the format and destination to which the data is to be sent.
- The second step is to configure the data that is to be collected as part of the sensor group.
- The third and final step is set the subscription between the sensor-group and the destination, along with the cadence at which to send the data (in msecs)
Additionally, SSL/TLS certificates can be used to encrypt all the data exchanged between the client and the server. Optional mechanisms are available for clients to provide certificates for mutual authentication
A sample configuration, with encryption enabled, is provided below.
telemetry
  certificate mycert.pem cisco.com
  destination-group 1
    ip address 172.31.219.148 port 50001 protocol gRPC encoding GPB
  sensor-group 1
    path sys/bgp/ depth unbounded
    path sys/epId-1 depth unbounded
    path sys/intf depth unbounded

  sensor-group 2
    data-source NX-API
    path "show environment power" depth 0
    path "show vlan id 2-5 counters� depth 0
    path "show processes cpu sort" depth 0

  subscription 1
    dst-grp 1
    snsr-grp 1 sample-interval 30000

  subscription 2
    dst-grp 1
    snsr-grp 2 sample-interval 60000
This data can then be sent to the collector of your choice, be it an inhouse tool, a commercial application such as Splunk or a Cisco provided solution such as DCNM.
To help adoption and understanding of the capabilities of telemetry, we have provided a sample collector, which is available on Docker Hub. This receiver can take gpb data streamed from the network, parse this into JSON which can then be forwarded to the the database of your choice.
The below dashboard is built using ELK, which is another opensource tool that is quite popular tool for IT Operations and Security Analytics.
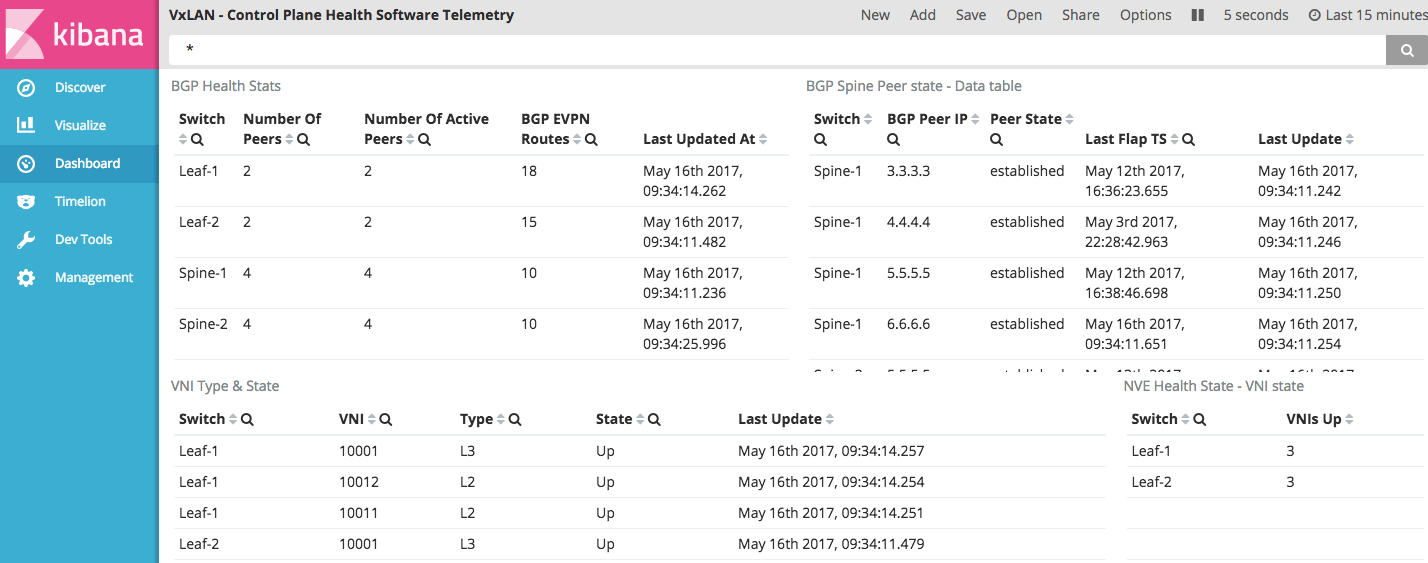
With this telemetry data, you can see network state and changes in near real-time, allowing easier and more timely visibility into your network.
Using a combination of open source tools, and well understood industry formats, you can begin your journey with telemetry data on NXOS.