Cisco Catalyst SD-WAN Manager API Sample Use Cases Study Lab
- Lab Overview
- Setup Instructions:
- Lab Flow/Use cases
- Usecase-1: Device and Monitoring APIs
- Usecase-2: Configuration APIs
- Usecase-3: App route statistics (Latency/Loss/Jitter)
- Usecase-4: Alarms APIs
- References
- Source Code
Lab Overview
Platforms and software used
| Component | Software Version |
|---|---|
| Cisco Catalyst SD-WAN Manager, SD-WAN Controller and SD-WAN Validator | 20.9.1 |
| cEdge (C8000v) | 17.9.1 |
| vEdge (vedge-cloud) | 20.9.1 |
Accessing the lab
Note: This lab utilizes the dCloud Cisco Catalyst SD-WAN v20.9.1/17.9.1 - Single DC v1 Sandbox.
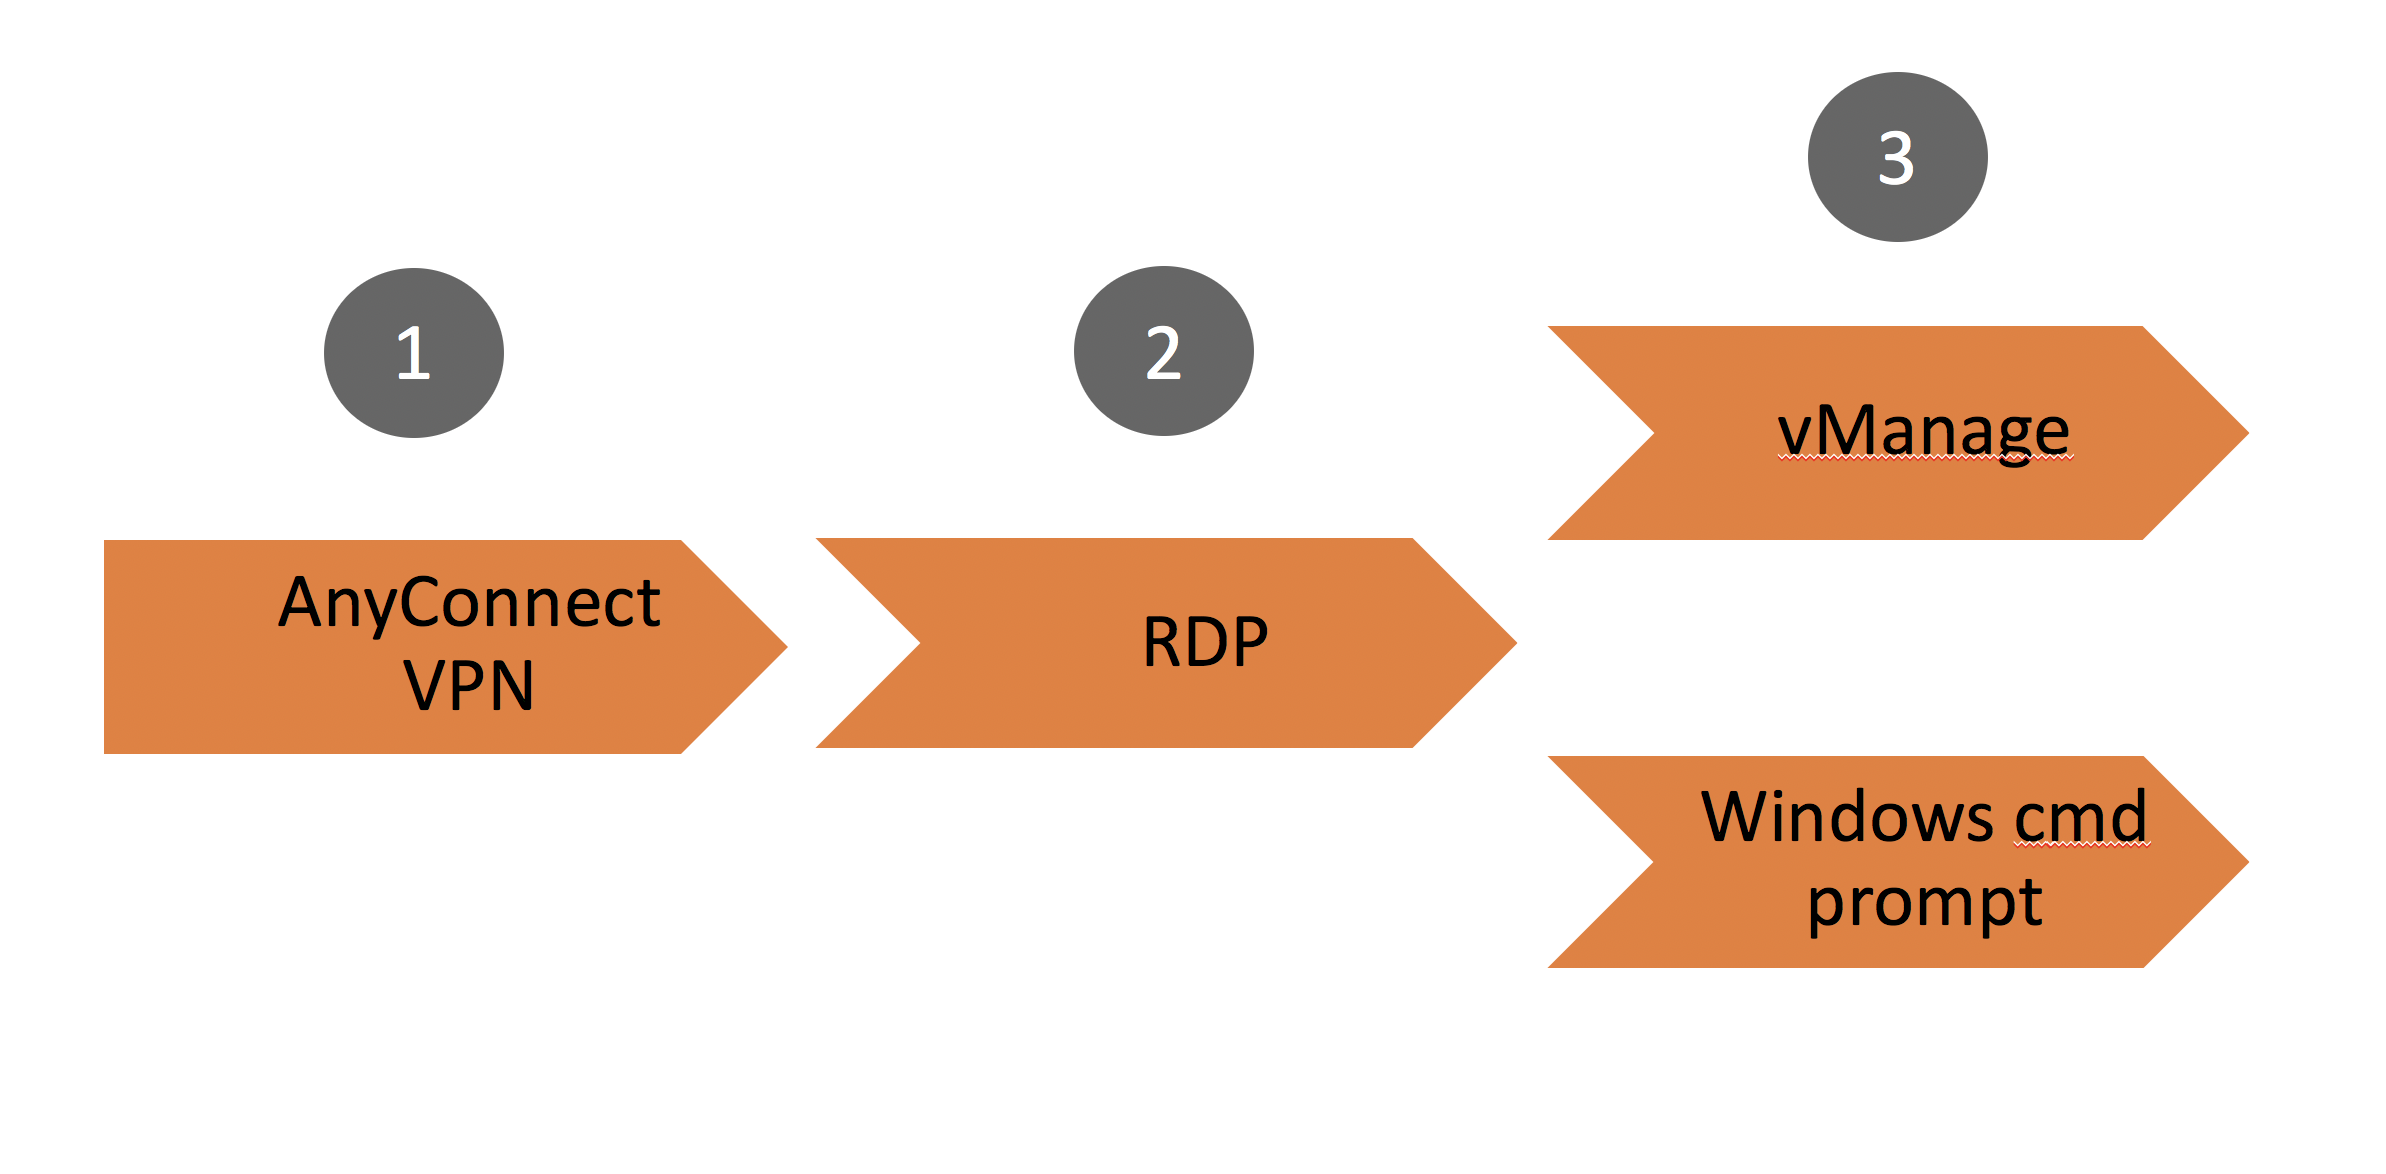
Step-1
Connect to your dCloud session by opening your Cisco AnyConnect client and entering the following information to connect to the lab session.
| Parameter | Input |
|---|---|
| AnyConnect Host | Instructor Provided |
| Username | Instructor Provided |
| Password | Instructor Provided |
Step-2
RDP

Mac users download link: https://itunes.apple.com/us/app/microsoft-remote-desktop-10/id1295203466
- Open your local Remote Desktop Client application and connect to the lab Jumphost.
- This Jumphost Windows VM has access to all network devices and will also run your Python scripts.
| Parameter | Input |
|---|---|
| Host | Instructor Provided |
| Username | Instructor Provided |
| Password | Instructor Provided |
Click ignore/continue if you receive an invalid certificate warning.
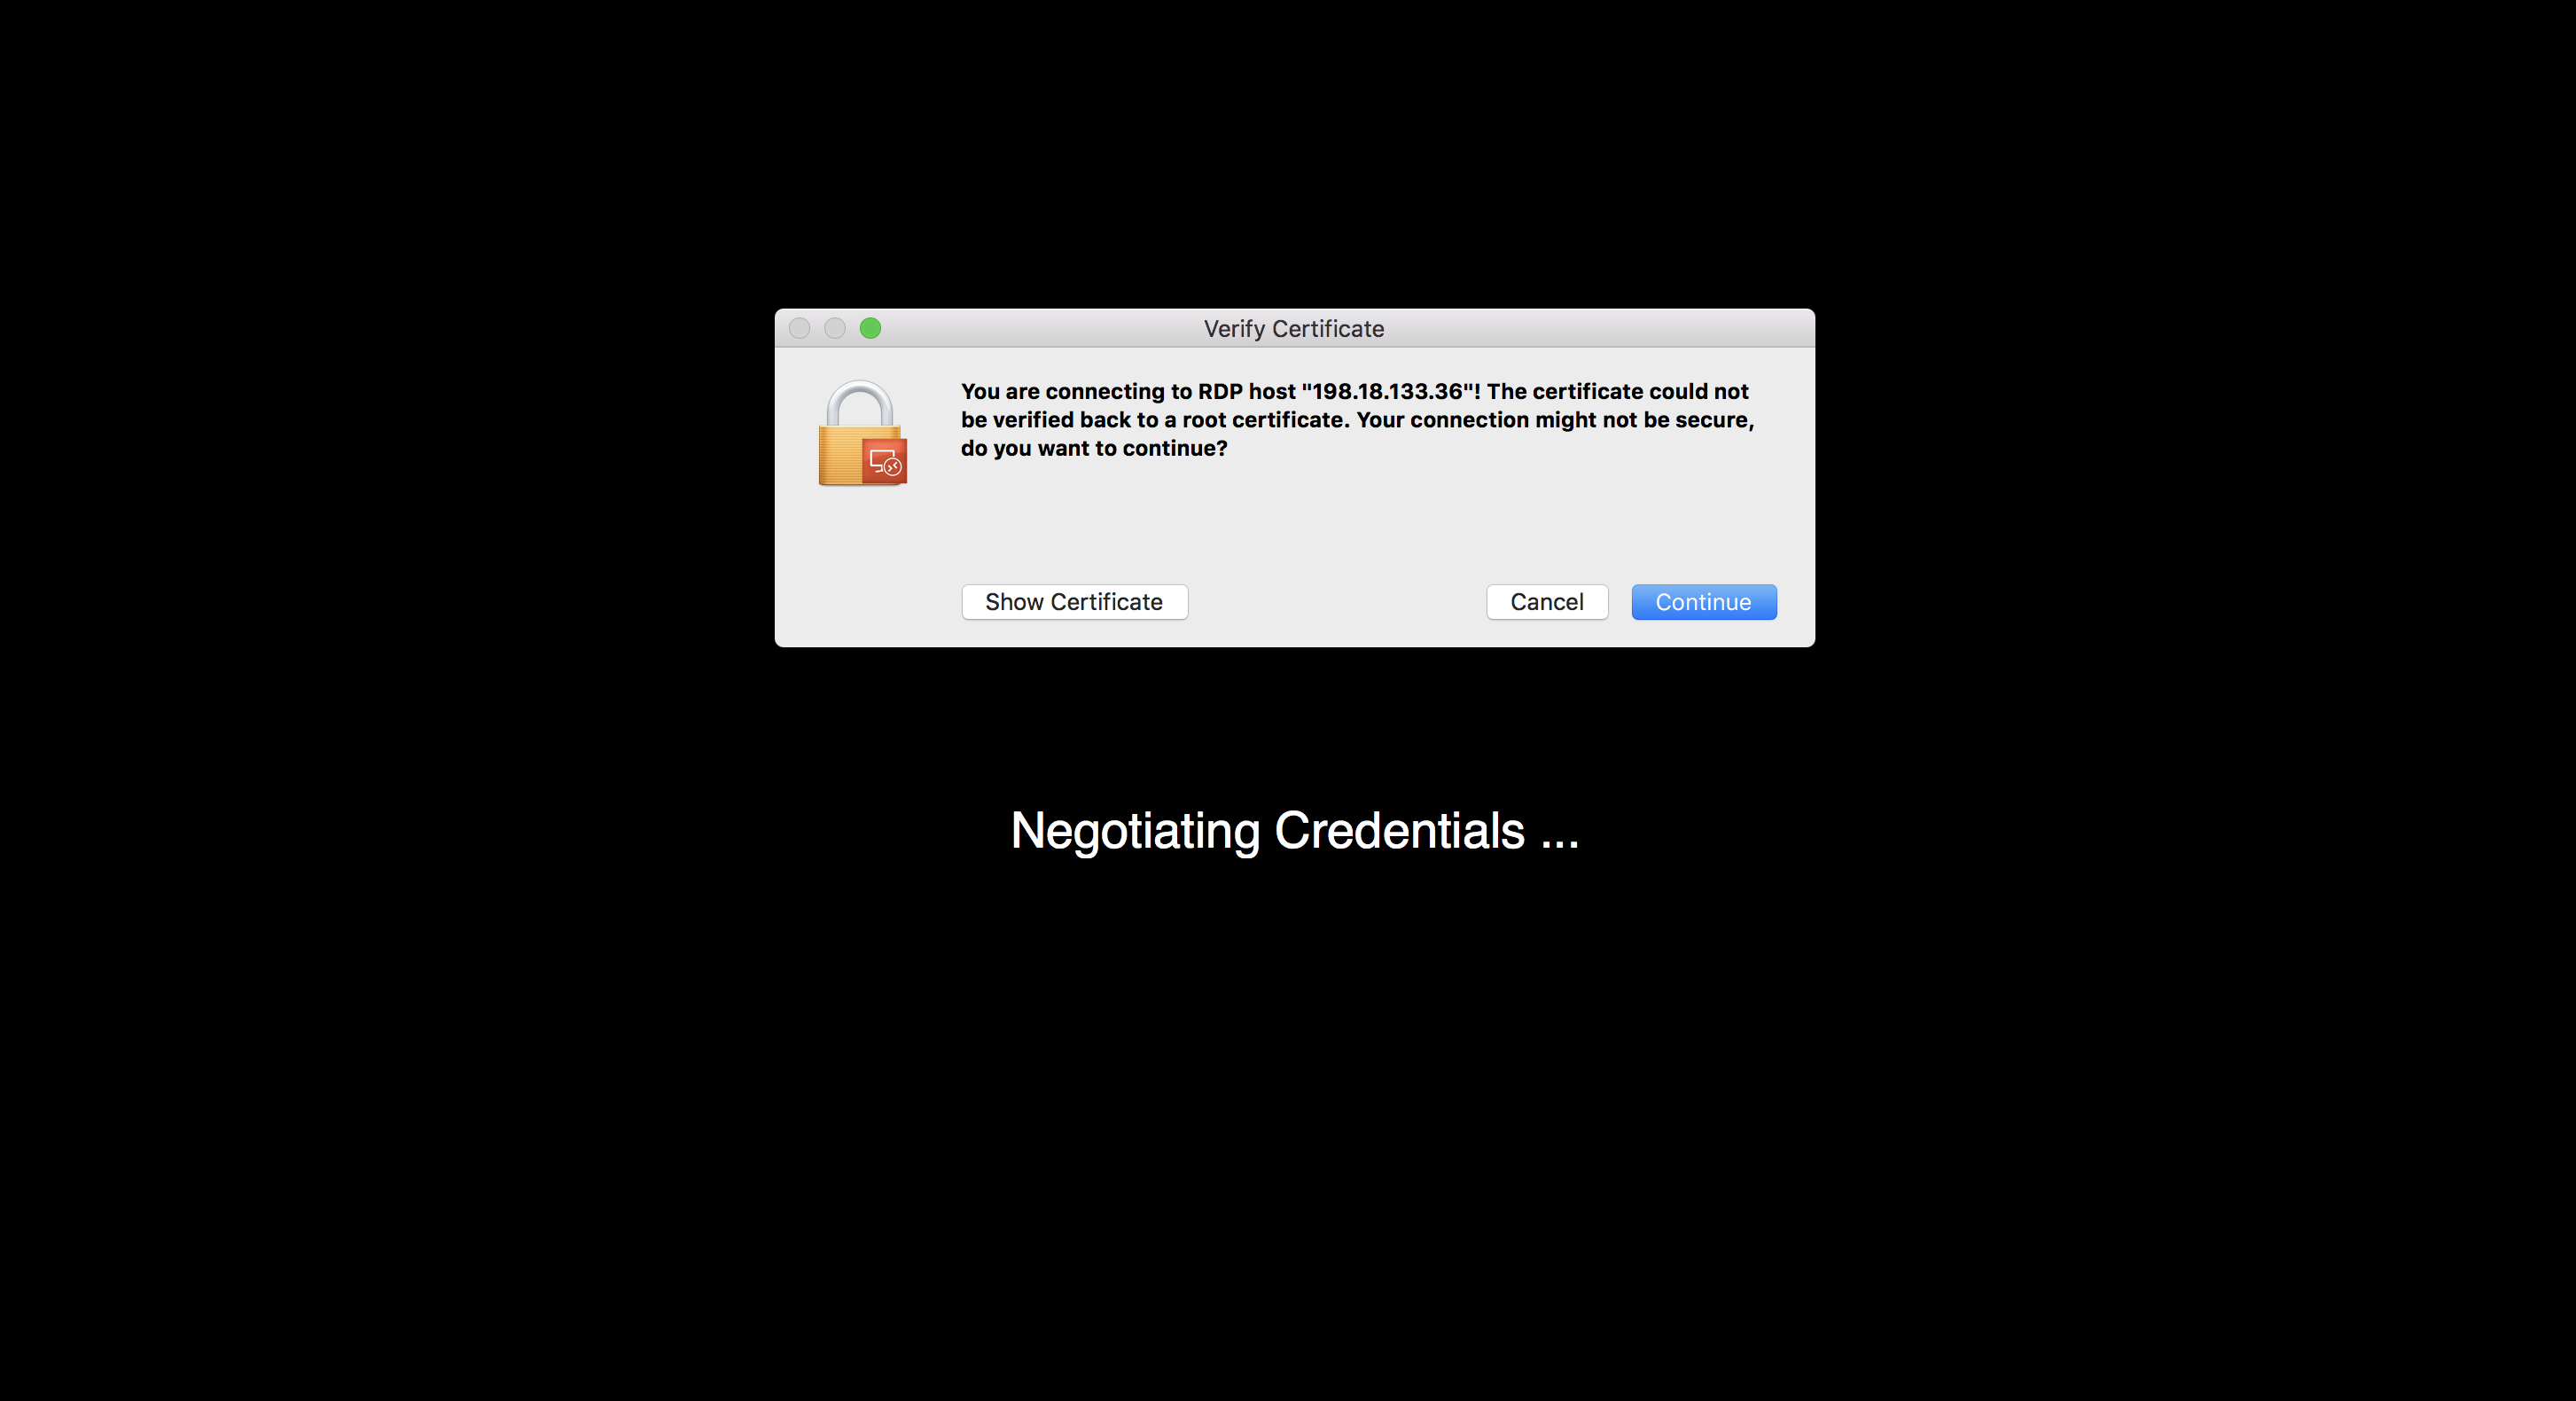
This will place you in “WKST1” which is the launching point for all lab tasks.
Step-3
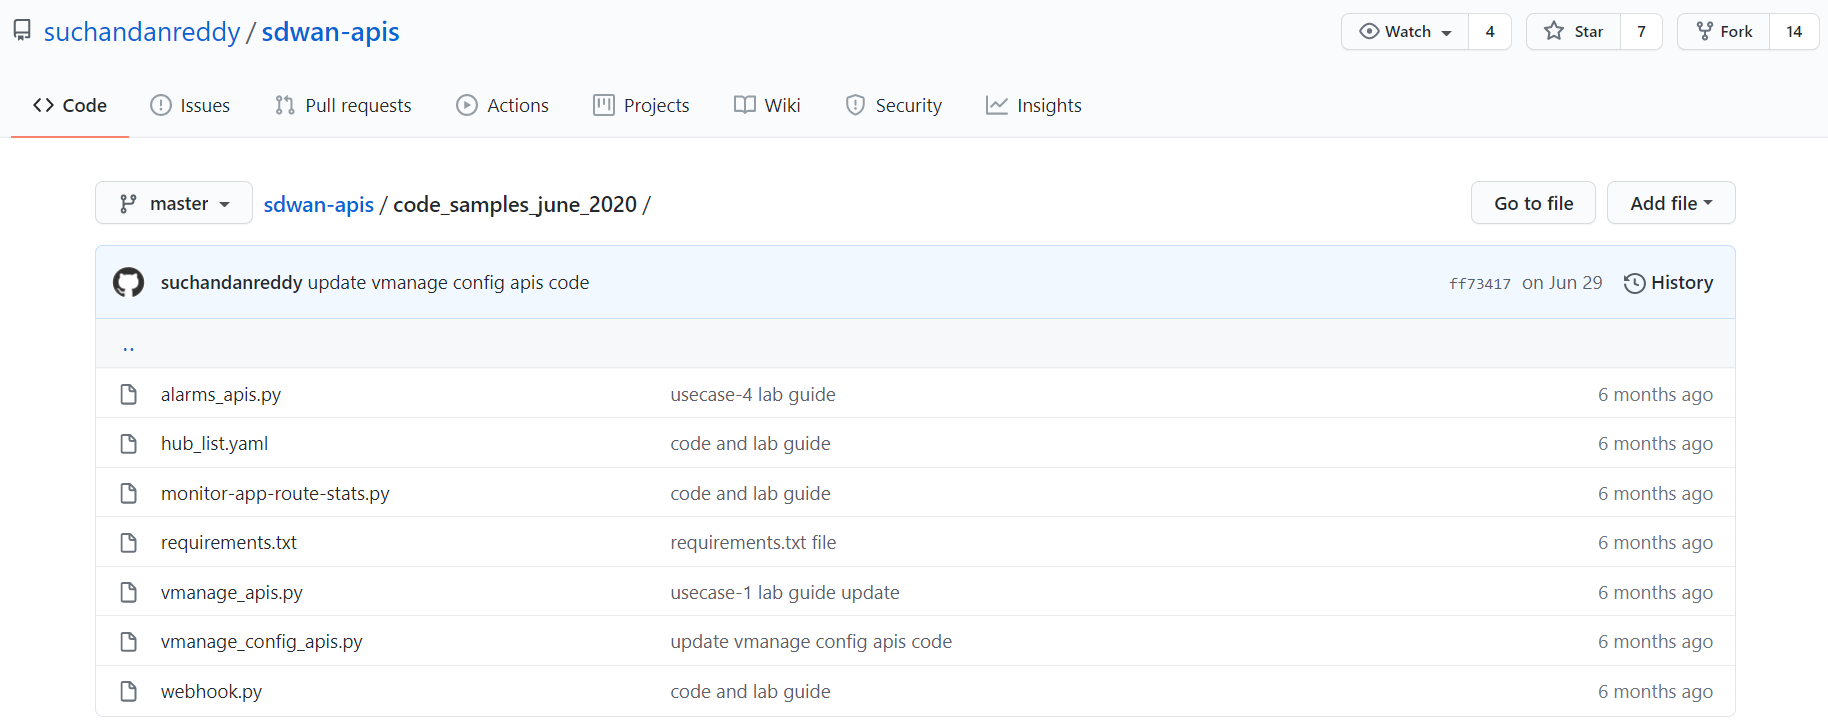
- Go to the repository https://github.com/suchandanreddy/sdwan-apis.
- Then, go to the "code_samples_june_2020" folder for the scripts used in the Lab guide. You can either clone the repo or download the scripts from the repo using your web browser.
Setup Instructions
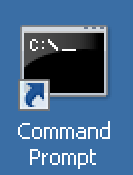
Launch a Command Prompt from the Windows VM Desktop using the following shortcut.
Step-1
Set the PATH env variable in the command prompt so that you can run pip3 to install all the packages needed for the Python scripts.
Command to set the PATH env for the current session:
set PATH=%PATH%;C:\Python3\Scripts\
Command to set the PATH env permanently:
setx PATH "%PATH%;C:\Python3\Scripts\"
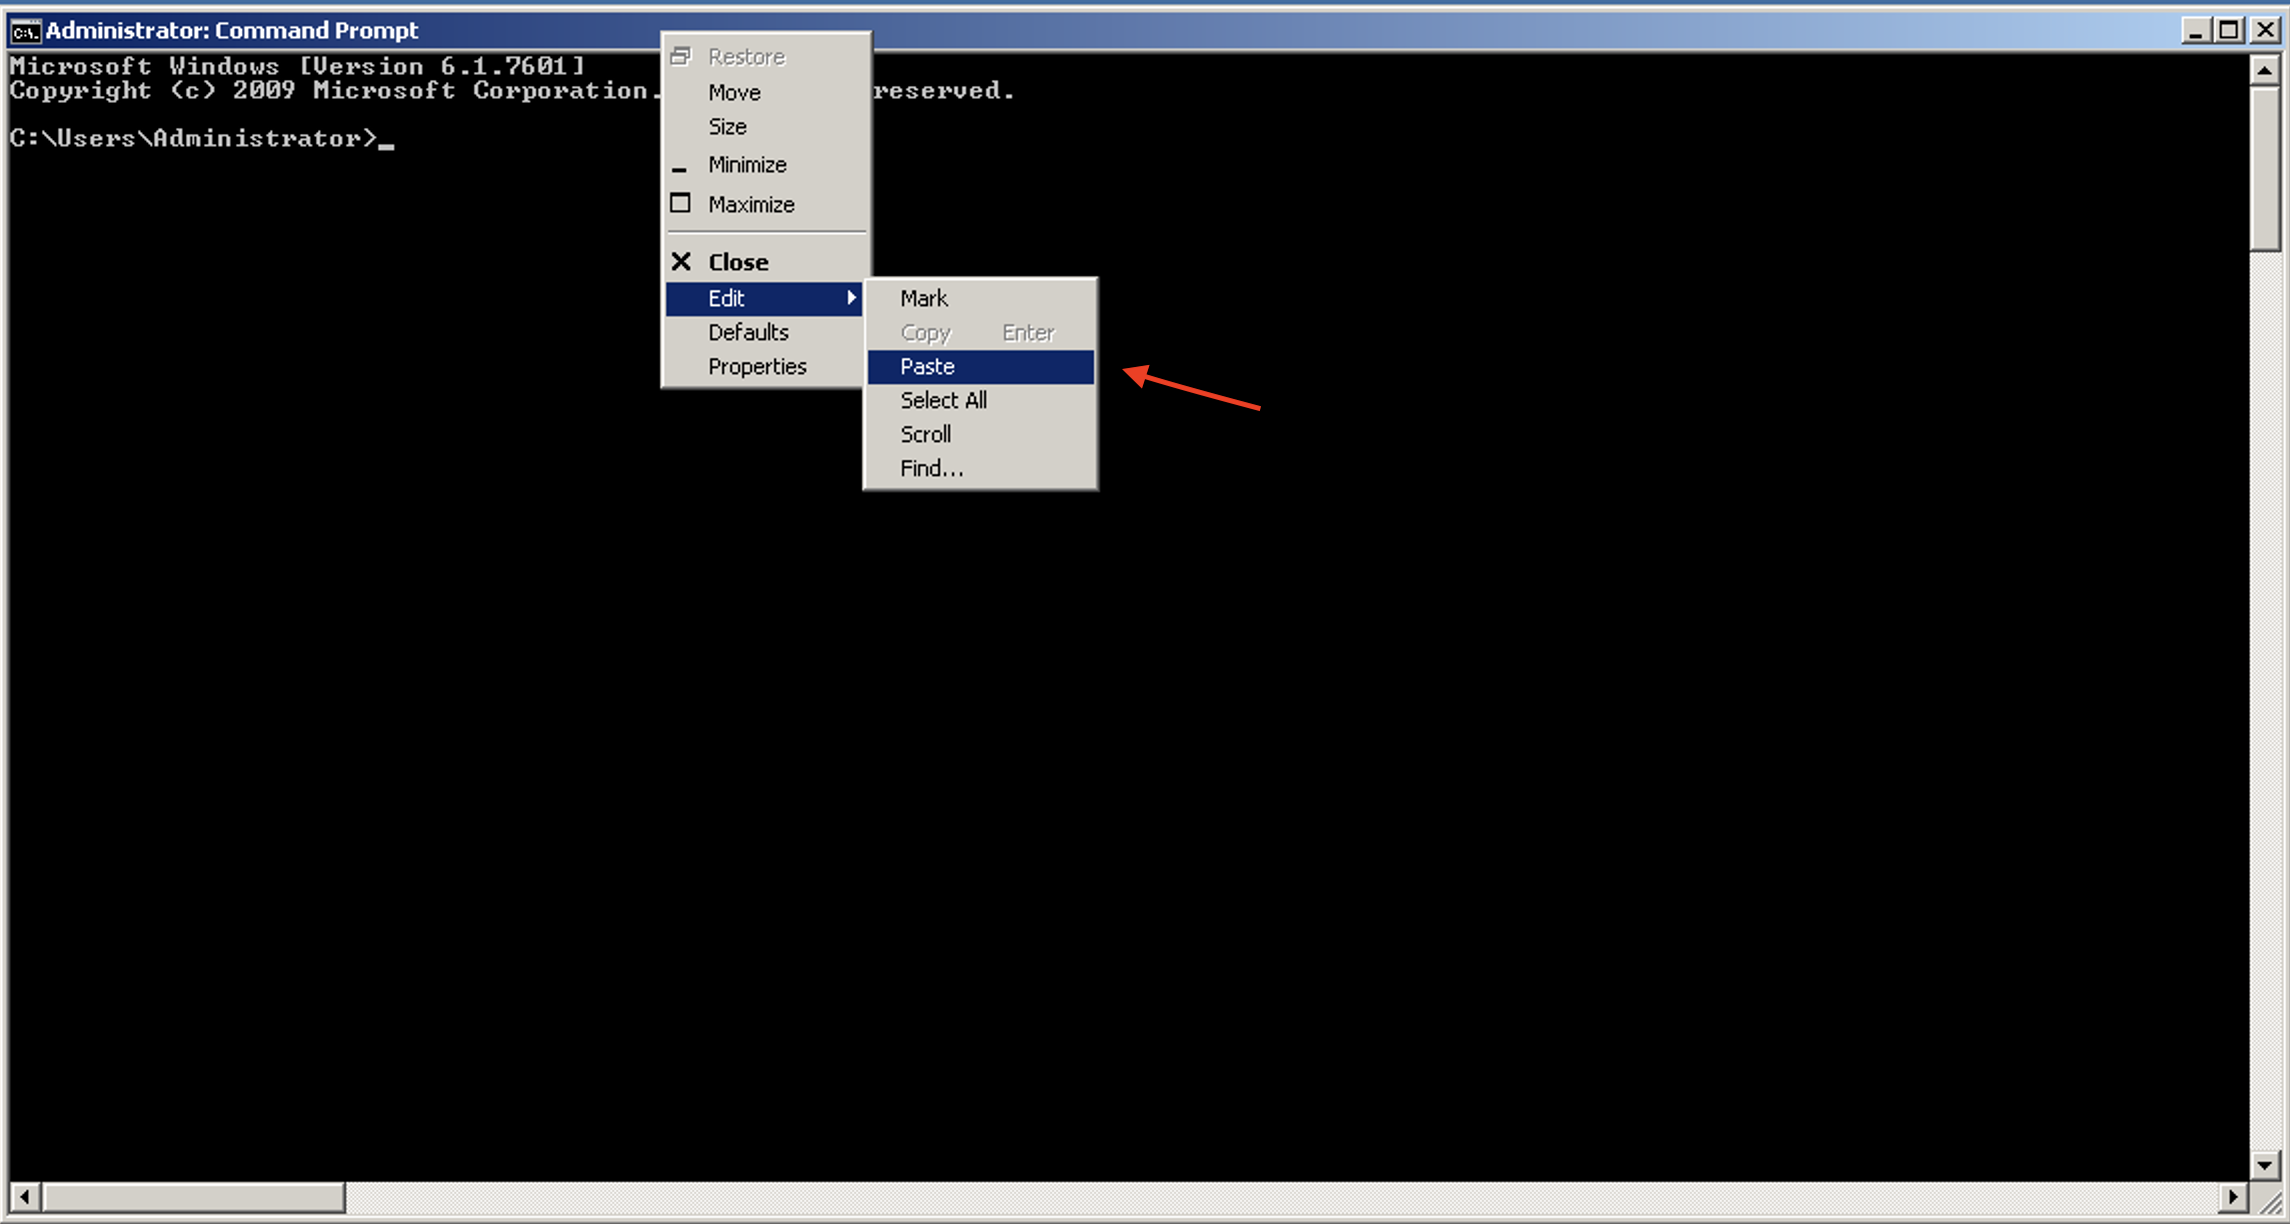
Highlight and copy one of the preceding commands and then paste it into the command prompt.
Step-2
Once the PATH environment variable is updated, run the following command: cd C:\Users\Administrator\Desktop\sdwan_prog_lab on command prompt.
Step-3
Now install the Python package requirements by using the command pip3 install -r requirements.txt
Step-4
Run the following commands using the SD-WAN Manager ip address, port, and login credentials from the dCloud session details. These commands should be run in command prompt to set the environment variables which stores SD-WAN Manager login details.
set vManage_host=Instructor Provided
set vManage_port=Instructor Provided
set vManage_username=Instructor Provided
set vManage_password=Instructor Provided
Lab Flow/Use Cases
The lab begins with all devices being up and running. We use the Python scripts to execute below REST API calls.
Device and Monitoring APIs
- Use a CLI-based Python application script that leverages the REST APIs to retrieve inventory data from SD-WAN Manager and control connections, OMP peers, BFD sessions, and system status of a wan vEdge router.Configuration APIs
- Use SD-WAN Manager APIs to retrieve a list of templates and policies, activate/deactivate a policy, and edit the preferred color in a specific Application Aware Routing Policy sequence.
Application Route Statistics APIs
- Use Aggregation Query APIs to retrieve Application Aware Routing statistics (BFD statistics) for Overlay Tunnels and create reports of average latency/loss/jitter and vQoE score.
Alarms APIs
- Use Simple Query APIs to retrieve alarms of specific categories and more details about consumed events which created specific alarms.
Now let's start with usecase-1 and learn how to use Device and Monitoring APIs
Usecase-1: Device and Monitoring APIs
Objective
How to retrieve devices list, control connection status, interface status, and system status using SD-WAN Manager REST APIs.
Code Components
This section which includes code snippets and structure of the CLI-based Python application script vManage_apis.py.
Click to expand!
- Python function that does login and authenticate with SD-WAN Manager instance.
The vManage_apis.py file contains an Authentication class that includes get_jsessionid() and get_token() methods.
Authentication
Let's start by going through the get_jsessionid() function that retrieves an authenticated session cookie, which is used by SD-WAN Manager to validate subsequent API calls.
Input parameters for get_jsessionid() are
- vManage_host
- vManage_port
- username
- password
On successful POST operations the get_jsessionid() returns the JSESSIONID cookie that is used in future API calls by client. By design, REST API is stateless so you use JSESSIONID for doing session tracking.
After the session cookie is received, starting from SD-WAN Manager 19.2 you need to run a GET request to the API endpoint /dataservice/client/token to retrieve the session token.
Input parameters for get_token() are
- vManage_host
- vManage_port
- jesssion_id
Code snip
class Authentication:

    @staticmethod
    def get_jsessionid(vManage_host, vManage_port, username, password):
        api = "/j_security_check"
        base_url = "https://%s:%s"%(vManage_host, vManage_port)
        url = base_url + api
        payload = {'j_username' : username, 'j_password' : password}

        response = requests.post(url=url, data=payload, verify=False)
        try:
            cookies = response.headers["Set-Cookie"]
            jsessionid = cookies.split(";")
            return(jsessionid[0])
        except:
            print("No valid JSESSION ID returned\n")
            exit()

    @staticmethod
    def get_token(vManage_host, vManage_port, jsessionid):
        headers = {'Cookie': jsessionid}
        base_url = "https://%s:%s"%(vManage_host, vManage_port)
        api = "/dataservice/client/token"
        url = base_url + api
        response = requests.get(url=url, headers=headers, verify=False)
        if response.status_code == 200:
            return(response.text)
        else:
            return None

Auth = Authentication()
jsessionid = Auth.get_jsessionid(vManage_host,vManage_port,vManage_username,vManage_password)
token = Auth.get_token(vManage_host,vManage_port,jsessionid)

if token is not None:
    header = {'Content-Type': "application/json",'Cookie': jsessionid, 'X-XSRF-TOKEN': token}
else:
    header = {'Content-Type': "application/json",'Cookie': jsessionid}
Note:
API request headers for GET/POST/PUT/DELETE are
- For SD-WAN Manager pre-19.2 - session cookie (jsessionid)
- For SD-WAN Manager post-19.2 - session cooke (jsessionid) and Token
Now let's have a look at the resource URL structure components that are used in GET/POST/PUT/DELETE requests.
Resource URL Structure Components
The resource URL to retrieve the inventory from vManage is https://<vManage-ip:port>/dataservice/device.
| Component | Description |
|---|---|
| https:// | Protocol over which data is sent between client and server. |
| Server or Host | Resolves to the IP and port to which to connect, for example : "vManage-ip:port". |
| Resource | The location of the data or object of interest, for example : "/device". |
| Parameters | Details to scope, filter, or clarify a request. Usually optional. |
Parameters Example
- URL :
https://<vManage-ip:port>/dataservice/device/bfd/state/device?deviceId=1.1.1.7 - "?deviceId=1.1.1.7" is used to filter out bfd state for device with system-ip/deviceId = 1.1.1.7
Note: All REST API calls to SD-WAN Manager contain the "/dataservice" root.
Step-1:
Open a Windows command prompt and execute the command **py -3.7 vManage_apis.py** to see the list of available options in this CLI-based Python application script.
Sample Response
C:\Users\Administrator\Desktop\sdwan_prog_lab>py -3.7 vManage_apis.py
Usage: vManage_apis.py [OPTIONS] COMMAND [ARGS]...

  Command line tool for monitoring Cisco SD-WAN solution components.

Options:
  --help  Show this message and exit.

Commands:
  attached-devices  Retrieve and return devices associated to a template.
  control-status    Retrieve and return information about control status.
  detach            Detach a device template.
  device-counters   Retrieve information about network device counters
  device-list       Retrieve and return network devices list.
  interface-status  Retrieve and return information about interface status.
  system-status     Retrieve and return information about system status.
List Devices
Now let’s make an API call to retrieve the list of devices in the SD-WAN fabric.
Once authentication is done with SD-WAN Manager using the get_jessiond() and get_token() functions,
you run the GET request to retrieve a list of all the devices in the fabric and store the JSON data that is returned by the API in the response variable. The resource URI for this is "/device", so the URL to fetch devices is https://vManage-ip:port/dataservice/device.
Now you extract the data portion of the JSON using response.json()['data'], and create a table with required fields in response.
Step-2:
At a Windows command prompt, run the command py -3.7 vManage_apis.py device-list to retrieve the list of devices
and print information such as Host-name, Site-ID, system-ip etc.. in table format.
Sample Response
C:\Users\Administrator\Desktop\sdwan_prog_lab>py -3.7 vManage_apis.py device-list

Retrieving the devices
╒═════════════╤═══════════════╤══════════════════════════════════════════╤═════════════╤═══════════╤════════════════╤═════════════════╕
│ Host-Name   │ Device Type   │ Device ID                                │ System IP   │   Site ID │ Version        │ Device Model    │
╞═════════════╪═══════════════╪══════════════════════════════════════════╪═════════════╪═══════════╪════════════════╪═════════════════╡
│ vManage     │ vManage       │ 5271ea7c-edb1-420b-be9a-4d25756785bd     │ 10.10.10.10 │        10 │ 20.1.1         │ vManage         │
├─────────────┼───────────────┼──────────────────────────────────────────┼─────────────┼───────────┼────────────────┼─────────────────┤
│ vSmart-1    │ vsmart        │ 10a98779-95f0-4383-871c-195d25bd9c74     │ 12.12.12.12 │        10 │ 20.1.1         │ vsmart          │
├─────────────┼───────────────┼──────────────────────────────────────────┼─────────────┼───────────┼────────────────┼─────────────────┤
│ vSmart-2    │ vsmart        │ 704bbc2f-aa9a-4068-84a2-fc31602ed553     │ 22.22.22.22 │        20 │ 20.1.1         │ vsmart          │
├─────────────┼───────────────┼──────────────────────────────────────────┼─────────────┼───────────┼────────────────┼─────────────────┤
│ vBond-1     │ vbond         │ abd5e9d7-9dee-4d00-98b5-fdc71de6ea63     │ 11.11.11.11 │           │ 20.1.1         │ vedge-cloud     │
├─────────────┼───────────────┼──────────────────────────────────────────┼─────────────┼───────────┼────────────────┼─────────────────┤
│ vBond-2     │ vbond         │ b6eec354-1d60-4c77-bb1a-7a704c28438b     │ 21.21.21.21 │           │ 20.1.1         │ vedge-cloud     │
├─────────────┼───────────────┼──────────────────────────────────────────┼─────────────┼───────────┼────────────────┼─────────────────┤
│ BR1-CEDGE1  │ vedge         │ CSR-940ad679-a16a-48ea-9920-16278597d98e │ 10.3.0.1    │       300 │ 17.02.01r.0.32 │ vedge-CSR-1000v │
├─────────────┼───────────────┼──────────────────────────────────────────┼─────────────┼───────────┼────────────────┼─────────────────┤
│ BR1-CEDGE2  │ vedge         │ CSR-04ed104b-86bb-4cb3-bd2b-a0d0991f6872 │ 10.3.0.2    │       300 │ 17.02.01r.0.32 │ vedge-CSR-1000v │
├─────────────┼───────────────┼──────────────────────────────────────────┼─────────────┼───────────┼────────────────┼─────────────────┤
│ DC1-VEDGE1  │ vedge         │ ebdc8bd9-17e5-4eb3-a5e0-f438403a83de     │ 10.1.0.1    │       100 │ 20.1.1         │ vedge-cloud     │
├─────────────┼───────────────┼──────────────────────────────────────────┼─────────────┼───────────┼────────────────┼─────────────────┤
│ DC1-VEDGE2  │ vedge         │ f21dbb35-30b3-47f4-93bb-d2b2fe092d35     │ 10.1.0.2    │       100 │ 20.1.1         │ vedge-cloud     │
╘═════════════╧═══════════════╧══════════════════════════════════════════╧═════════════╧═══════════╧════════════════╧═════════════════╛

C:\Users\Administrator\Desktop\sdwan_prog_lab>
Control Status
Note:
To learn how to use a particular option, run the help command `py -3.7 vManage_apis.py control-status --help`- Use system-ip 10.3.0.1 to fetch monitoring information for host BR1-CEDGE1 router and use system-ip 10.1.0.1 for DC1-VEDGE1 router
Sample Response
C:\Users\Administrator\Desktop\sdwan_prog_lab>py -3.7 vManage_apis.py control-status --help
Usage: vManage_apis.py control-status [OPTIONS]

  Retrieve and return information about the control status of network devices in the SD-WAN fabric

  Example command:     ./vManage_apis.py control-status --system_ip 10.3.0.1

Options:
  --system_ip TEXT  System IP address of the device.
  --help            Show this message and exit.
Step-3:
At a Windows command prompt, run the command py -3.7 vManage_apis.py control-status --system_ip 10.3.0.1 to get
the control connections status for WAN edge router with system ip address 10.3.0.1
With the control-status option, you use resource URI /device/control/synced/connections?deviceId=
Sample Response
C:\Users\Administrator\Desktop\sdwan_prog_lab>py -3.7 vManage_apis.py control-status --system_ip 10.3.0.1
Retrieving the Control Status

Control Connection status for Device = 10.3.0.1
╒═════════════╤══════════════════╤═════════╤══════════════════════╕
│ Peer Type   │ Peer System IP   │ state   │ Last Updated (UTC)   │
╞═════════════╪══════════════════╪═════════╪══════════════════════╡
│ vManage     │ 10.10.10.10      │ up      │ 06/27/2020 05:13:30  │
├─────────────┼──────────────────┼─────────┼──────────────────────┤
│ vsmart      │ 12.12.12.12      │ up      │ 06/27/2020 05:13:30  │
├─────────────┼──────────────────┼─────────┼──────────────────────┤
│ vsmart      │ 22.22.22.22      │ up      │ 06/27/2020 05:13:30  │
├─────────────┼──────────────────┼─────────┼──────────────────────┤
│ vsmart      │ 12.12.12.12      │ up      │ 06/27/2020 05:13:30  │
├─────────────┼──────────────────┼─────────┼──────────────────────┤
│ vsmart      │ 22.22.22.22      │ up      │ 06/27/2020 05:13:30  │
╘═════════════╧══════════════════╧═════════╧══════════════════════╛

C:\Users\Administrator\Desktop\sdwan_prog_lab
Interface Status
Step-4:
At a Windows command prompt, run the command py -3.7 vManage_apis.py interface-status --system_ip 10.1.0.1 to get
the interfaces status for a WAN edge router with system ip address 10.1.0.1
In interface-status option, you use resource URI device/interface/synced?deviceId=<system-ip> to fetch the interface status of a network device in the fabric.
Sample Response
C:\Users\Administrator\Desktop\sdwan_prog_lab>py -3.7 vManage_apis.py interface-status --system_ip 10.1.0.1

Retrieving the Interface Status

Interfaces status for Device =  10.1.0.1
╒══════════════════╤═════════════════╤══════════╤══════════════════════╕
│ Interface Name   │ IP address      │   VPN ID │ Operational status   │
╞══════════════════╪═════════════════╪══════════╪══════════════════════╡
│ ge0/1            │ 100.64.0.2/30   │        0 │ Up                   │
├──────────────────┼─────────────────┼──────────┼──────────────────────┤
│ ge0/2            │ 100.64.2.26/30  │        0 │ Up                   │
├──────────────────┼─────────────────┼──────────┼──────────────────────┤
│ system           │ 10.1.0.1/32     │        0 │ Up                   │
├──────────────────┼─────────────────┼──────────┼──────────────────────┤
│ ge0/0            │ 10.1.10.150/24  │       10 │ Up                   │
├──────────────────┼─────────────────┼──────────┼──────────────────────┤
│ ge0/3            │ 10.1.20.150/24  │       20 │ Up                   │
├──────────────────┼─────────────────┼──────────┼──────────────────────┤
│ eth0             │ 198.18.3.100/24 │      512 │ Up                   │
╘══════════════════╧═════════════════╧══════════╧══════════════════════╛
C:\Users\Administrator\Desktop\sdwan_prog_lab>py -3.7 vManage_apis.py interface-status --system_ip 10.3.0.1

Retrieving the Interface Status

Interfaces status for Device =  10.3.0.1
╒═══════════════════╤══════════════╤══════════╤══════════════════════╕
│ Interface Name    │ IP address   │   VPN ID │ Operational status   │
╞═══════════════════╪══════════════╪══════════╪══════════════════════╡
│ GigabitEthernet2  │ 100.64.0.18  │        0 │ if-oper-state-ready  │
├───────────────────┼──────────────┼──────────┼──────────────────────┤
│ Tunnel2           │ 0.0.0.0      │        0 │ if-oper-state-ready  │
├───────────────────┼──────────────┼──────────┼──────────────────────┤
│ GigabitEthernet1  │ 198.18.3.104 │      512 │ if-oper-state-ready  │
├───────────────────┼──────────────┼──────────┼──────────────────────┤
│ GigabitEthernet3  │ 100.64.0.29  │        0 │ if-oper-state-ready  │
├───────────────────┼──────────────┼──────────┼──────────────────────┤
│ GigabitEthernet4  │ 100.64.2.38  │        0 │ if-oper-state-ready  │
├───────────────────┼──────────────┼──────────┼──────────────────────┤
│ GigabitEthernet5  │ 10.3.10.2    │       10 │ if-oper-state-ready  │
├───────────────────┼──────────────┼──────────┼──────────────────────┤
│ GigabitEthernet6  │ 10.3.20.2    │       20 │ if-oper-state-ready  │
├───────────────────┼──────────────┼──────────┼──────────────────────┤
│ GigabitEthernet7  │ 10.3.40.2    │       40 │ if-oper-state-ready  │
├───────────────────┼──────────────┼──────────┼──────────────────────┤
│ Tunnel4           │ 0.0.0.0      │        0 │ if-oper-state-ready  │
├───────────────────┼──────────────┼──────────┼──────────────────────┤
│ Tunnel2000000001  │ 0.0.0.0      │        0 │ if-oper-state-ready  │
├───────────────────┼──────────────┼──────────┼──────────────────────┤
│ Loopback65528     │ 192.168.1.1  │    65528 │ if-oper-state-ready  │
├───────────────────┼──────────────┼──────────┼──────────────────────┤
│ VirtualPortGroup0 │ 192.168.1.1  │    65529 │ if-oper-state-ready  │
├───────────────────┼──────────────┼──────────┼──────────────────────┤
│ VirtualPortGroup1 │ 192.0.2.1    │        0 │ if-oper-state-ready  │
├───────────────────┼──────────────┼──────────┼──────────────────────┤
│ sdwan_system_ip   │              │        0 │ if-oper-state-ready  │
╘═══════════════════╧══════════════╧══════════╧══════════════════════╛
Device Counters
Step-5:
At a Windows command prompt, run the command py -3.7 vManage_apis.py device-counters --system_ip 10.3.0.1 to get
the number of OMP Peers, vSmart connections, BFD sessions for a WAN edge router with system ip address 10.3.0.1
In device-counters option, we use resource URI /device/counters?deviceId=<system-ip> to get the number of OMP Peers, vSmart connections, and BFD sessions.
Sample Response
C:\Users\Administrator\Desktop\sdwan_prog_lab>py -3.7 vManage_apis.py device-counters --system_ip 10.3.0.1
Retrieving the Device Counters

Device Counters for device =  10.3.0.1
╒════════════════╤══════════════════╤══════════════════════╤═══════════════════╤═════════════════════╕
│   OMP Peers Up │   OMP Peers Down │   vSmart connections │   BFD Sessions Up │   BFD Sessions Down │
╞════════════════╪══════════════════╪══════════════════════╪═══════════════════╪═════════════════════╡
│              2 │                0 │                    4 │                 4 │                   0 │
╘════════════════╧══════════════════╧══════════════════════╧═══════════════════╧═════════════════════╛
C:\Users\Administrator\Desktop\sdwan_prog_lab>py -3.7 vManage_apis.py device-counters --system_ip 10.1.0.1
Retrieving the Device Counters

Device Counters for device =  10.1.0.1
╒════════════════╤══════════════════╤══════════════════════╤═══════════════════╤═════════════════════╕
│   OMP Peers Up │   OMP Peers Down │   vSmart connections │   BFD Sessions Up │   BFD Sessions Down │
╞════════════════╪══════════════════╪══════════════════════╪═══════════════════╪═════════════════════╡
│              2 │                0 │                    4 │                 4 │                   0 │
╘════════════════╧══════════════════╧══════════════════════╧═══════════════════╧═════════════════════╛
System Status
Step-6:
At a Windows command prompt, run the command py -3.7 vManage_apis.py system-status --system_ip 10.1.0.1 to get
the uptime, version, memory and CPU usage information for a WAN edge router with system ip address 10.1.0.1
In system-status option, we use resource URI /device/system/status?deviceId=<system-ip> to fetch the system status of a such network device in the fabric.
C:\Users\Administrator\Desktop\sdwan_prog_lab>py -3.7 vManage_apis.py system-status --system_ip 10.1.0.1

Retrieving the System Status

System status for Device: 10.1.0.1
╒═════════════╤═════════════════════════════╤═══════════╤═══════════════╤══════════════╕
│ Host name   │ Up time                     │ Version   │   Memory Used │   CPU system │
╞═════════════╪═════════════════════════════╪═══════════╪═══════════════╪══════════════╡
│ DC1-VEDGE1  │ 0 days 17 hrs 00 min 08 sec │ 20.1.1    │       2137264 │        47.25 │
╘═════════════╧═════════════════════════════╧═══════════╧═══════════════╧══════════════╛
C:\Users\Administrator\Desktop\sdwan_prog_lab>py -3.7 vManage_apis.py system-status --system_ip 10.3.0.1

Retrieving the System Status

System status for Device: 10.3.0.1
╒═════════════╤═════════════════════════════╤════════════════╤═══════════════╤══════════════╕
│ Host name   │ Up time                     │ Version        │   Memory Used │   CPU system │
╞═════════════╪═════════════════════════════╪════════════════╪═══════════════╪══════════════╡
│ BR1-CEDGE1  │ 0 days 16 hrs 58 min 53 sec │ 17.02.01r.0.32 │       3810300 │         6.05 │
╘═════════════╧═════════════════════════════╧════════════════╧═══════════════╧══════════════╛

C:\Users\Administrator\Desktop\sdwan_prog_lab>
Conclusion
In this section you learned how to collect a list of devices and monitor the following information:
- Control connections status
- Interface status
- OMP Peers and BFD sessions
- System Status
Usecase-2: Configuration APIs
Objective
How to retrieve list of templates and policies, activate/deactivate a central policy, and edit the preferred color in a specific Application Aware Routing Policy sequence.
Configuration APIs
In this section you use the CLI-based Python application script vManage_config_apis.py. Run the command py -3.7 vManage_config_apis.py to see all the options supported by the Python application script.
Sample Response
C:\Users\Administrator\Desktop\sdwan_prog_lab>py -3.7 vManage_config_apis.py
Usage: vManage_config_apis.py [OPTIONS] COMMAND [ARGS]...

  Command line tool for SD-WAN Manager Templates and Policy Configuration APIs.

Options:
  --help  Show this message and exit.

Commands:
  activate-policy        Activate centralized policy.
  approute-modify-color  Modify the Preferred Color in existing App Aware.
  deactivate-policy      Deactivate centralized policy.
  policy-list            Retrieve and return centralized policies list.
  template-list          Retrieve and return templates list.
Templates list
Step-1:
At a Windows command prompt, run the command py -3.7 vManage_config_apis.py template-list to retrieve the list
of defined device templates.
With the template-list option, you use the resource URI /template/device to fetch the list of templates.
Sample Response
C:\Users\Administrator\Desktop\sdwan_prog_lab>py -3.7 vManage_config_apis.py template-list
Retrieving the available templates
╒═══════════════════════════════════╤═════════════════════╤══════════════════════════════════════╤════════════════════╕
│ Template Name                     │ Device Type         │ Template ID                          │   Attached devices │
╞═══════════════════════════════════╪═════════════════════╪══════════════════════════════════════╪════════════════════╡
│ vSmartConfigurationTemplate       │ vsmart              │ e1f3de23-1ded-49d8-85b1-1e6ab668775f │                  0 │
├───────────────────────────────────┼─────────────────────┼──────────────────────────────────────┼────────────────────┤
│ Factory_Default_ISR_4331_V01      │ vedge-ISR-4331      │ f52767b8-db2c-42f1-8f5f-2f5d295dee25 │                  0 │
├───────────────────────────────────┼─────────────────────┼──────────────────────────────────────┼────────────────────┤
│ Factory_Default_CSR_1000V_V01     │ vedge-CSR-1000v     │ 4b523c91-82ee-46a2-91b1-87e0c7e9bef5 │                  0 │
├───────────────────────────────────┼─────────────────────┼──────────────────────────────────────┼────────────────────┤
│ BranchType2Template-vEdge         │ vedge-cloud         │ 2463357c-4261-48fe-a13e-bab7aec5c002 │                  0 │
├───────────────────────────────────┼─────────────────────┼──────────────────────────────────────┼────────────────────┤
│ VSMART-device-template            │ vsmart              │ 55eb96ec-237d-4170-8841-3321a04e01a7 │                  2 │
├───────────────────────────────────┼─────────────────────┼──────────────────────────────────────┼────────────────────┤
│ 20_1_BranchType1Template-CSR      │ vedge-CSR-1000v     │ 9b921d74-37e8-460b-9966-5a6ddef871b9 │                  2 │
├───────────────────────────────────┼─────────────────────┼──────────────────────────────────────┼────────────────────┤
│ DC-vEdges                         │ vedge-cloud         │ 6c7d22bc-73d5-4877-9402-26c75a22bd08 │                  2 │
├───────────────────────────────────┼─────────────────────┼──────────────────────────────────────┼────────────────────┤
│ BranchType1Template-CSR           │ vedge-CSR-1000v     │ c62e6fba-fb53-4562-b436-3878de0fbbc2 │                  0 │
├───────────────────────────────────┼─────────────────────┼──────────────────────────────────────┼────────────────────┤
│ Factory_Default_C1111_8PLTELA_V01 │ vedge-C1111-8PLTELA │ b6aacdc9-ae1f-4471-a359-13657ce98204 │                  0 │
╘═══════════════════════════════════╧═════════════════════╧══════════════════════════════════════╧════════════════════╛

C:\Users\Administrator\Desktop\sdwan_prog_lab>
Centralized Policies List
Step-1:
At a Windows command prompt, run the command py -3.7 vManage_config_apis.py policy-list to retrieve the list
of centralized policies defined.
With the policy-list option, we use resource URI /template/policy/vsmart to fetch the list of centralized policies.
Sample Response
C:\Users\Administrator\Desktop\sdwan_prog_lab>py -3.7 vManage_config_apis.py policy-list
Retrieving the available Centralized Policies
╒══════════════════════════════╤═══════════════╤══════════════════════════════════════╤═══════════════════╕
│ Policy Name                  │ Policy Type   │ Policy ID                            │ Active/Inactive   │
╞══════════════════════════════╪═══════════════╪══════════════════════════════════════╪═══════════════════╡
│ StrictHub-n-Spoke            │ feature       │ a8205140-92d9-4688-a127-c70d5f1b93a5 │ False             │
├──────────────────────────────┼───────────────┼──────────────────────────────────────┼───────────────────┤
│ MultiTopologyPolicy          │ feature       │ 45f0b251-bce6-4b6b-bb8c-de7dbf13ea0f │ False             │
├──────────────────────────────┼───────────────┼──────────────────────────────────────┼───────────────────┤
│ MultiTopologyPlusFWInsertion │ feature       │ b33477d1-1ebc-4080-ba44-b89dbf14fef7 │ False             │
├──────────────────────────────┼───────────────┼──────────────────────────────────────┼───────────────────┤
│ MultiTopologyPlusACL         │ feature       │ 7f156d32-537d-493f-9a7d-53d9e1f05a19 │ False             │
├──────────────────────────────┼───────────────┼──────────────────────────────────────┼───────────────────┤
│ MultiTopologyPlusAppRoute    │ feature       │ 12df3ed9-6b1f-4b0a-91a2-377cefb8039f │ False             │
├──────────────────────────────┼───────────────┼──────────────────────────────────────┼───────────────────┤
│ cflowd_policy                │ cli           │ 1c865c35-05ac-43a7-a6ee-6328138cd1c4 │ False             │
├──────────────────────────────┼───────────────┼──────────────────────────────────────┼───────────────────┤
│ Hub-Spoke-Policy-PCI         │ feature       │ 67b2d453-671f-4eaf-b79a-d1c4c0069f1a │ False             │
╘══════════════════════════════╧═══════════════╧══════════════════════════════════════╧═══════════════════╛
Activate a Centralized Policy
Step-1
At a Windows command prompt, run the command py -3.7 vManage_config_apis.py activate-policy --name MultiTopologyPlusAppRoute
to activate a centralized(vSmart) policy with a name of MultiTopologyPlusAppRoute.
With the activate-policy option, you use the resource URI /template/policy/vsmart/activate/<policy-uuid>?confirm=true to activate a centralized policy.
Sample Response
C:\Users\Administrator\Desktop\sdwan_prog_lab>py -3.7 vManage_config_apis.py activate-policy --name MultiTopologyPlusAppRoute
Policy UUID for MultiTopologyPlusAppRoute is 12df3ed9-6b1f-4b0a-91a2-377cefb8039f

Successfully activated vSmart Policy MultiTopologyPlusAppRoute.
Modify Preferred Color in App Route Policy
Step-1
At a Windows command prompt, run the command py -3.7 vManage_config_apis.py approute-modify-color --name AppRoutePolicyVPN10
--seq_name DSCP46 --pref_color public-internet to update the preferred color to public-internet in sequence DSCP46
of app route policy AppRoutePolicyVPN10
Sample Response
C:\Users\Administrator\Desktop\sdwan_prog_lab>py -3.7 vManage_config_apis.py approute-modify-color --name AppRoutePolicyVPN10 --seq_name DSCP46 --pref_color public-internet

Retrieved app aware route policy definition for AppRoutePolicyVPN10.

Master templates affected: ['55eb96ec-237d-4170-8841-3321a04e01a7']

Successfully updated Preferred Color to public-internet in sequence DSCP46 of policy AppRoutePolicyVPN10.
Deactivate Centralized Policy
Step-1
At a Windows command prompt, run the command py -3.7 vManage_config_apis.py deactivate-policy --name MultiTopologyPlusAppRoute
to deactivate a centralized(vSmart) policy with the name MultiTopologyPlusAppRoute
With the deactivate-policy option, you use the resource URI /template/policy/vsmart/deactivate/<policy-uuid>?confirm=true to deactivate a centralized policy.
Sample Response
C:\Users\Administrator\Desktop\sdwan_prog_lab>py -3.7 vManage_config_apis.py deactivate-policy --name MultiTopologyPlusAppRoute
Policy UUID for MultiTopologyPlusAppRoute is 12df3ed9-6b1f-4b0a-91a2-377cefb8039f

Successfully deactivated vSmart Policy MultiTopologyPlusAppRoute.
Conclusion
In this section you learned how to use SD-WAN Manager APIs to:
- Retrieve the list of templates and policies
- Activate a centralized policy
- Update preferred color in a particular Application Aware Routing Policy sequence
- Deactivate a centralized policy
Usecase-3: App route statistics (Latency/Loss/Jitter)
Objective
How to retrieve the App Route Statistics (Latency/Loss/Jitter) using Aggregation APIs and create an Excel/csv report.
Resource URL structure components
A Resource URL retrieves app route statistics such as latency, loss, and jitter using aggregation APIs in /statistics/approute/fec/aggregation.
URL : https://<vManage-ip>/dataservice/statistics/approute/fec/aggregation
| Component | Description |
|---|---|
| https:// | Protocol over which data is sent between client and server |
| Server or Host | Resolves to the IP and port to connect with, for example : "vManage-ip:port" |
| Resource | The location of the data or object of interest, for example : "/statistics/approute/fec/aggregation" |
Use case requirements
For a given Hub-n-Spoke topology, you use SD-WAN Manager APIs to retrieve and create a report of Average App Route Statistics (loss/latency/jitter) and vQoE score based on the following conditions.
- User input - Start and end date for report
- Average of stats for every 24 hours
- For all tunnels(BFD sessions) originating from hub routers
Now let’s start using the Python script to fetch the app route statistics with the following steps:
- Log in and authenticate to a SD-WAN Manager instance
- Run a GET request to
https://<vManage-ip>/dataservice/statistics/approute/fieldsto retrieve the supported query fields - Build a query to specify the rules on how to retrieve and aggregate Application Aware Routing statistics.
- Perform the POST operation by sending the query in payload
App Route Query Fields
Step-1
At a Windows command prompt, run the command py -3.7 monitor-app-route-stats.py to get the list of options available
in the **monitor-app-route-stats.py** CLI-based Python application script.
Sample Response
C:\Users\Administrator\Desktop\sdwan_prog_lab>py -3.7 monitor-app-route-stats.py
Usage: monitor-app-route-stats.py [OPTIONS] COMMAND [ARGS]...

  Command line tool for monitoring Application Aware Routing
  statistics(Latency/Loss/Jitter/vQoE Score).

Options:
  --help  Show this message and exit.

Commands:
  approute-fields  Retrieve App route Aggregation API Query fields.
  approute-report  Create Average Approute statistics report.
  approute-stats   Create Average Approute statistics for all tunnels...

C:\Users\Administrator\Desktop\sdwan_prog_lab>
Step-2
At a Windows command prompt, run the command py -3.7 monitor-app-route-stats.py approute-fields to get the list of
Application Routing Aggregation API supported Query fields.
Sample Response
C:\Users\Administrator\Desktop\sdwan_prog_lab>py -3.7 monitor-app-route-stats.py approute-fields
vdevice_name(string)  local_system_ip(string)   src_ip(string)    loss_percentage(number)  name(string)
host_name(string)     remote_system_ip(string)  dst_ip(string)    jitter(number)           loss(number)
device_model(string)  local_color(string)       src_port(number)  tx_pkts(number)
statcycletime(date)   remote_color(string)      dst_port(number)  rx_pkts(number)
entry_time(date)      proto(string)             total(number)     tx_octets(number)
vip_idx(number)       window(number)            latency(number)   rx_octets(number)
Using the Application Routing Aggregation API query fields, let's define the Aggregation API Query Payload.
Aggregation API Query Payload
Aggregation API query is created using below constructs
Query Conditions
Aggregation components:
Field
Histogram
Metrics
For example, we need to first define Query Conditions(rules) Based on these rules the data records are extracted from vManage. Some of the common supported rules are to select based on stats entry_time to get statistics in specific intervals of time, then use various query fields like local system-ip, local color, remote color to retrieve the records for specific vEdge routers transport circuits in that time interval.
Once the query conditions are determined, you then provide the fields, histogram and metrics, which determine how data is aggregated.
Example-1
- The following example query retrieves average latency/loss/jitter and vqoe score for the last hour for all tunnels between routers with provided local and remote system-ip:
{
  "query": {
    "condition": "AND",
    "rules": [
      {
        "value": [
          "1"
        ],
        "field": "entry_time",
        "type": "date",
        "operator": "last_n_hours"
      },
      {
        "value": [
          "<Router-1 System-IP>"
        ],
        "field": "local_system_ip",
        "type": "string",
        "operator": "in"
      },
      {
        "value": [
          "<Router-2 System-IP>"
        ],
        "field": "remote_system_ip",
        "type": "string",
        "operator": "in"
      }
    ]
  },
  "aggregation": {
    "field": [
      {
        "property": "name",
        "sequence": 1,
        "size": 6000
      }
    ],
    "metrics": [
      {
        "property": "loss_percentage",
        "type": "avg"
      },
      {
        "property": "vqoe_score",
        "type": "avg"
      },
      {
        "property": "latency",
        "type": "avg"
      },
      {
        "property": "jitter",
        "type": "avg"
      }
    ]
  }
}
Example-2
The following query retrieves the application route statistics between the start date and end date as query conditions so you get the average latency/loss/jitter between those two intervals. (Note that only the UTC timezone is supported in query conditions so you need to convert the user input to UTC timezone if needed)
Here, the statistics are aggregated in 24 hour intervals so with that you can get a report of statistics for provided start and end dates with the average of statistics for 24 hour interval.
{
      "query": {
          "condition": "AND",
          "rules": [
          {
              "value": [
                        start_date+"T00:00:00 UTC",
                        end_date+"T23:59:59 UTC"
                       ],
              "field": "entry_time",
              "type": "date",
              "operator": "between"
          },
          {
              "value": [
                      hub["system_ip"]
                      ],
              "field": "local_system_ip",
              "type": "string",
              "operator": "in"
          }
          ]
      },
      "aggregation": {
          "field": [
          {
              "property": "name",
              "size": 6000,
              "sequence": 1
          },
          {
              "property": "proto",
              "sequence": 2
          },
          {
              "property": "local_system_ip",
              "sequence": 3
          },
          {
              "property": "remote_system_ip",
              "sequence": 4
          }
          ],
          "histogram": {
          "property": "entry_time",
          "type": "hour",
          "interval": 24,
          "order": "asc"
          },
          "metrics": [
          {
              "property": "latency",
              "type": "avg"
          },
          {
              "property": "jitter",
              "type": "avg"
          },
          {
              "property": "loss_percentage",
              "type": "avg"
          },
          {
              "property": "vqoe_score",
              "type": "avg"
          }
          ]
      }
      }
Using the Example-1 and Example-2 query lets perform POST operation to retrieve the app route statistics latency/loss/jitter and vQoE score.
POST Operation
Step-1
At a Windows command prompt, run the command py -3.7 monitor-app-route-stats.py approute-stats to run POST request
using the query in Example-1. For example, to retrieve average latency/loss/jitter and vQoE score between two routers for
 the last hour.

Enter 10.1.0.1 as Router-1 System IP address and 10.3.0.1 as Router-2 System IP address.
Sample Response
C:\Users\Administrator\Desktop\sdwan_prog_lab>py -3.7 monitor-app-route-stats.py approute-stats
Enter Router-1 System IP address : 10.1.0.1
Enter Router-2 System IP address : 10.3.0.1

Average application route statistics between 10.1.0.1 and 10.3.0.1 for the last hour

╒═════════════════════════════════════════════╤══════════════╤═══════════╤═══════════════════╤═══════════╕
│ Tunnel name                                 │   vQoE score │   Latency │   Loss percentage │    Jitter │
╞═════════════════════════════════════════════╪══════════════╪═══════════╪═══════════════════╪═══════════╡
│ 10.1.0.1:biz-internet-10.3.0.1:biz-internet │           10 │ 19.3356   │                 0 │ 9.02238   │
├─────────────────────────────────────────────┼──────────────┼───────────┼───────────────────┼───────────┤
│ 10.1.0.1:mpls-10.3.0.1:mpls                 │           10 │  0.960481 │                 0 │ 0.0549828 │
╘═════════════════════════════════════════════╧══════════════╧═══════════╧═══════════════════╧═══════════╛

Average application route statistics between 10.3.0.1 and 10.1.0.1 for the last hour

╒═════════════════════════════════════════════╤══════════════╤═══════════╤═══════════════════╤════════════╕
│ Tunnel name                                 │   vQoE score │   Latency │   Loss percentage │     Jitter │
╞═════════════════════════════════════════════╪══════════════╪═══════════╪═══════════════════╪════════════╡
│ 10.3.0.1:biz-internet-10.1.0.1:biz-internet │           10 │  17.505   │         0.447436  │ 10.2047    │
├─────────────────────────────────────────────┼──────────────┼───────────┼───────────────────┼────────────┤
│ 10.3.0.1:mpls-10.1.0.1:mpls                 │           10 │   1.27852 │         0.0279648 │  0.0604027 │
╘═════════════════════════════════════════════╧══════════════╧═══════════╧═══════════════════╧════════════╛
Step-2
At a Windows command prompt, run the command py -3.7 monitor-app-route-stats.py approute-report --help to run
POST request using the query in Example-2. For example, to retrieve average latency/loss/jitter and vQoE score between
hub and spoke routers for the provided start to end date.
Sample Response
C:\Users\Administrator\Desktop\sdwan_prog_lab>py -3.7 monitor-app-route-stats.py approute-report --help
Usage: monitor-app-route-stats.py approute-report [OPTIONS]

  Create Average Approute statistics report.
  Provide YAML file which includes list of Hub System IP addresses.
  Example command: ./monitor-app-route-stats.py approute-report
  --hub_list_file <.yaml>

Options:
  --hub_list_file TEXT  YAML file with list of hub system ip addresses
  --help                Show this message and exit.
C:\Users\Administrator\Desktop\sdwan_prog_lab>more hub_list.yaml
hub_routers:
  - system_ip: 10.1.0.1
  - system_ip: 10.1.0.2
Step-3
At a Windows command prompt, run the command py -3.7 monitor-app-route-stats.py approute-report --hub_list_file hub_list.yaml
to run POST request using the query in Example-2. For example, to retrieve average latency/loss/jitter and vQoE score.
Sample Response
C:\Users\Administrator\Desktop\sdwan_prog_lab>py -3.7 monitor-app-route-stats.py approute-report --hub_list_file hub_list.yaml
Please enter start date(YYYY-MM-DD): 2020-06-27
Please enter end date(YYYY-MM-DD): 2020-06-29

Created report of Average Application Route statistics for tunnels between hub routers and spokes for 2020-06-27 and 2020-06-29
Now Launch Google Chrome and use the built-in Excel viewer to see the spreadsheet, or use the CSVviewer application on Windows VM(Jumphost) to view the CSV file.
Conclusion
In this section you have learned how to build an Aggregation API Query to retrieve Average Application Aware Routing statistics and create report in Excel/csv format.
Usecase-4: Alarms APIs
Objective
How to retrieve alarms using Simple Query vManage APIs.
Resource URL Structure Components
https://<vManage-ip:port>/dataservice/alarms
| Component | Description |
|---|---|
| http:// or https:// | Protocol over which data is sent between client and server |
| Server or Host | Resolves to the IP and port to which to connect, for example : "vManage-ip:port" |
| Resource | The location of the data or object of interest, for example : "/dataservice/alarms" |
Now let’s start using the Python script to fetch the alarms by using below steps:
- Log in and authenticate to a SD-WAN Manager instance
- Build a query to specify the rules on how to retrieve alarms
- Perform the POST operation by sending the query in a POST request payload
Using the Authentication class you will authenticate with SD-WAN Manager and get the session cookie (JSESSIONID) and token (The token is retrieved only if SD-WAN Manager version is 19.2 or above). The session cookie and token are used in subsequent API calls for validating the user session.
Now let's define a query that can be used to collect alarms using POST operation on https://vManage-ip/dataservice/alarms.
Query Payload
Example-1
- The between operator can be used to fetch the alarms for a custom interval for example i.e. 08:50:00 UTC to 8:55:00 UTC (5 mins interval)
{
  "query": {
    "condition": "AND",         # Logical AND operation among rules defined below
    "rules": [
      {
        "value": [              # Alarms between 08:50:00 and 08:55:00 on 06/20/2020
          "2020-06-20T08:50:00 UTC",
          "2020-06-20T08:55:00 UTC"
        ],
        "field": "entry_time",
        "type": "date",
        "operator": "between"
      }
    ]
  },
  "size": 10000
}
Example-2
- Collect only Active Critical, Medium alarms between 08:50 and 08:55
{
  "query": {
    "condition": "AND",      # Logical AND operation among rules defined below
    "rules": [
      {
        "value": [           # Alarms between 08:50:00 and 08:55:00 on 06/20/2020
          "2020-06-20T08:50:00 UTC",
          "2020-06-20T08:55:00 UTC"
        ],
        "field": "entry_time",
        "type": "date",
        "operator": "between"
      },
      {
        "value": [           # Only alarms with severity level Critical and Medium
          "Medium",
          "Critical"
        ],
        "field": "severity",
        "type": "string",
        "operator": "in"
      },
      {
        "value": [
          "true"            # Value is set to false for cleared alarms and true for active alarms
        ],
        "field": "active",
        "type": "string",
        "operator": "in"
      }
    ]
  },
  "size": 10000
}
Example-3
- Collect Active/Cleared and Unacknowledged alarms for specific alarm type/tag during the last 24 hours.
{
    "query": {
        "condition": "AND",         # Logical AND operation among rules defined below
        "rules": [
        {
            "value": [              # last 24 hours
                "24"
            ],
            "field": "entry_time",
            "type": "date",
            "operator": "last_n_hours"
        },
        {
            "value": [              # Return both active and cleared alarms
            "false","true"
            ],
            "field": "active",
            "type": "string",
            "operator": "in"
        },
        {
            "value": [              # Alarm tag to filter specific type of alarms
            alarm_tag
            ],
            "field": "rule_name_display",
            "type": "string",
            "operator": "in"
        },
        {
            "value":[              # Alarms which are Unacknowledged
                "false",
            ],
            "field": "acknowledged",
            "type": "string",
            "operator": "in"
        }
        ]
    }
}
Using the query in Example-3 lets perform POST operation to retrieve the specific type of alarms.
POST Operation
Input parameters for POST operation
- endpoint (vManage server ip address)
- resource or mountpoint represented by the URL
- The query that defines rules on how to retrieve alarms is sent using the payload.
Now let's have a look at the sample responses to POST operation.
Sample Responses
- Every alarm can be uniquely identified based on the uuid value which is associated with it.
- If an alarm is cleared, then the uuid of the alarm that has cleared it is associated with the key
cleared_byand cleared time is associated with the keycleared_time.
Example-1
    {
      "values": [
        {
          "color": "biz-internet",
          "system-ip": "10.3.0.1",
          "host-name": "BR1-CEDGE1",
          "site-id": "300"
        }
      ],
      "values_short_display": [
        {
          "color": "biz-internet",
          "system-ip": "10.3.0.1",
          "host-name": "BR1-CEDGE1"
        }
      ],
      "message": "A tloc went down",
      "type": "tloc_down",
      "eventname": "rulename",
      "rulename": "tloc_down",
      "component": "Control",
      "severity": "Major",
      "severity_number": 2,
      "entry_time": 1592776950525,
      "statcycletime": 1592776950525,
      "receive_time": 1592776950525,
      "rule_name_display": "Control_TLOC_Down",
      "uuid": "16d95667-7f0e-4e84-91f3-72497ed7b913",
      "active": false,
      "devices": [
        {
          "color": "biz-internet",
          "system-ip": "10.3.0.1"
        }
      ],
      "consumed_events": [
        {
          "builtBy": "EventDataCollector",
          "vManage-system-ip": "12.12.12.12",
          "entry_time": 1592776894000,
          "eventname": "control-connection-state-change",
          "linkupdate": true,
          "component": "Control",
          "severity-level": "major",
          "system-ip": "12.12.12.12",
          "host-name": "vSmart-1",
          "personality": "vsmart",
          "peer-type": "vedge",
          "peer-system-ip": "10.3.0.1",
          "peer-vManage-system-ip": "0.0.0.0",
          "public-ip": "100.64.2.2",
          "public-port": "5079",
          "src-color": "default",
          "remote-color": "biz-internet",
          "uptime": "0:00:20:30",
          "new-state": "down",
          "receive_time": 1592776890527,
          "eventId": "a5dc4d54-f491-4d9d-91bb-8a68f4a88e9f",
          "eventCreationTime": 1592776890540
        },
        {
          "builtBy": "EventDataCollector",
          "vManage-system-ip": "22.22.22.22",
          "entry_time": 1592776893000,
          "eventname": "control-connection-state-change",
          "linkupdate": true,
          "component": "Control",
          "severity-level": "major",
          "system-ip": "22.22.22.22",
          "host-name": "vSmart-2",
          "personality": "vsmart",
          "peer-type": "vedge",
          "peer-system-ip": "10.3.0.1",
          "peer-vManage-system-ip": "0.0.0.0",
          "public-ip": "100.64.2.2",
          "public-port": "5079",
          "src-color": "default",
          "remote-color": "biz-internet",
          "uptime": "0:00:20:30",
          "new-state": "down",
          "receive_time": 1592776890525,
          "eventId": "3c4c1063-b1cd-478b-81af-a26f47c8b638",
          "eventCreationTime": 1592776890538
        },
        {
          "builtBy": "EventDataCollector",
          "vManage-system-ip": "10.10.10.10",
          "entry_time": 1592776890000,
          "eventname": "control-connection-state-change",
          "linkupdate": true,
          "component": "Control",
          "severity-level": "major",
          "system-ip": "10.10.10.10",
          "host-name": "vManage",
          "personality": "vManage",
          "peer-type": "vedge",
          "peer-system-ip": "10.3.0.1",
          "peer-vManage-system-ip": "0.0.0.0",
          "public-ip": "100.64.2.2",
          "public-port": "5079",
          "src-color": "default",
          "remote-color": "biz-internet",
          "uptime": "0:00:20:30",
          "new-state": "down",
          "receive_time": 1592776890524,
          "eventId": "69a504d1-7f09-4d43-80ff-2404b615969b",
          "eventCreationTime": 1592776890539
        }
      ],
      "acknowledged": false,
      "possible_causes": [
        "Trying to determine possible root causes"
      ],
      "tenant": "default",
      "cleared_by": "e8bd6f6e-0be0-429d-b5c8-e0bd90ef4989",
      "cleared_time": 1592776967212,
      "id": "AXLY54rgGEYcfPHKCx0_"
    }
The entry_time and cleared_time values are in epoch format.
Prerequisites(Step-0)
- Launch mputty and select any of the Branch or DC routers
- Login details for Branch or DC routers is admin/admin
- Run the command
clear control connections(for vEdge) orclear sdwan control connectionsto trigger alarms which can be retrieved in the next steps using APIs)
For DC1-VEDGE1 router
![]()
For BR1-CEDGE1 router
![]()
Confirm the triggered alarm is received on vManage from vEdge routers.
- Go to section Monitor -> Alarms and confirm if the Control TLOC Down/Up alarm is reported so that we can retrieve these alarm details using APIs in the next steps.
Step-1
At a Windows command prompt run the command py -3.7 alarms_apis.py to see all the options supported by the script.
Sample Response
C:\Users\Administrator\Desktop\sdwan_prog_lab>py -3.7 alarms_apis.py
Usage: alarms_apis.py [OPTIONS] COMMAND [ARGS]...

  Command line tool for retrieving SD-WAN Alarms.

Options:
  --help  Show this message and exit.

Commands:
  ack-alarm         Acknowledge specific alarms of provided uuids.
  alarm-details     Retrieve consumed event details for provided alarm uuid.
  list-alarms       Retrieve list of alarms related to provided tag.
  list-alarms-tags  Retrieve list of alarm tags.
Step-2
Run the script with list-alarms-tags option. For example, py -3.7 alarms_apis.py list-alarms-tags to see all the alarm names/tags supported.
C:\Users\Administrator\Desktop\sdwan_prog_lab>py -3.7 alarms_apis.py list-alarms-tags

Retrieving the alarm tags

BFD_Node_Up               OMP_All_Vsmarts_Down                 Device Upgrade Failed
BFD_Between_Sites_Down    OMP_Site_Up                          Container upgrade failed
BFD_TLOC_Up               OMP_Node_Up                          New_CSR_Generated
BFD_TLOC_Down             BGP_Router_Down                      Root_Cert_Chain_Uninstalled
BFD_Site_Down             BGP_Router_Up                        Default App List Update
BFD_Site_Up               OSPF_Router_Down                     Interface_State_Change
BFD_Node_Down             OSPF_Router_Up                       aaa_Admin_Password_Change
BFD_Between_Sites_Up      Container reload failed              Unsupported_SFP_Detected
Control_Vsmart_Down       System_IP_Reuse                      Device Activation Failed
Control_Vsmart_Up         Pim_Interface_State_Change           System_Reboot_Issued
Control_Site_Down         Interface_Admin_State_Change         Devices Have No License Associated
Control_TLOC_Down         Container activate failed            Clear_Installed_Certificate
Control_vManage_Up        System-IP_Change                     Cloud On Ramp
Control_Site_Up           DHCP_Server_State_Change             UTD signature package installation failed
Control_vManage_Down      OMP_State_Change                     Org_Name_Change
Control_Vsmarts_Up        Site-ID_Change                       Container reset failed
Control_Node_Up           Disk_Usage                           ZTP Upgrade Failed
Control_TLOC_Up           Domain-ID_Change                     Pseudo_Commit_Status
Control_Node_Down         Memory_Usage                         Container App installation failed
Control_All_Vsmarts_Down  CPU_Load                             Control_vBond_State_Change
OMP_Site_Down             vEdge_Serial_File_Uploaded           Template_Rollback
OMP_Node_Down             Cloned_Vedge_Detected                Root_Cert_Chain_Installed
OMP_Vsmarts_Up            vSmart/vManage_Serial_File_Uploaded  Process_Restart


C:\Users\Administrator\Desktop\sdwan_prog_lab>
Step-3
Let's use the Control_TLOC_Down alarm tag to get all the Control TLOC Down alarms in the Overlay fabric for last 24 hours.
Run the script py -3.7 alarms_apis.py list-alarms --alarm_tag Control_TLOC_Down.
The script uses the Simple Query payload from Example-3 to query for all alarms with the provided tag for last the 24 hours that are ackknowledged.
C:\Users\Administrator\Desktop\sdwan_prog_lab>py -3.7 alarms_apis.py list-alarms --help
Usage: alarms_apis.py list-alarms [OPTIONS]

  Retrieve a list of alarms related to the provided tag.
  Example command: ./alarms_apis.py list-alarms --alarm_tag OMP_Site_Up

Options:
  --alarm_tag TEXT  Alarm tag name
  --help            Show this message and exit

C:\Users\Administrator\Desktop\sdwan_prog_lab>
C:\Users\Administrator\Desktop\sdwan_prog_lab>py -3.7 alarms_apis.py list-alarms --alarm_tag Control_TLOC_Down

Retrieving the alarms with tag Control_TLOC_Down

╒═════════════════════╤═══════════════════╤══════════╤══════════╤════════════╤══════════════════════════════════════════════════╕
│ Date & Time (PDT)   │ Alarm tag         │ Active   │ Viewed   │ Severity   │ Details                                          │
╞═════════════════════╪═══════════════════╪══════════╪══════════╪════════════╪══════════════════════════════════════════════════╡
│ 06/21/2020 14:41:42 │ Control_TLOC_Down │ False    │ False    │ Major      │ UUID: dfdd7822-6c19-49f3-844b-47402ff1d616       │
│                     │                   │          │          │            │ Values:                                          │
│                     │                   │          │          │            │ [                                                │
│                     │                   │          │          │            │     {                                            │
│                     │                   │          │          │            │         "color": "biz-internet",                 │
│                     │                   │          │          │            │         "host-name": "BR1-CEDGE1",               │
│                     │                   │          │          │            │         "site-id": "300",                        │
│                     │                   │          │          │            │         "system-ip": "10.3.0.1"                  │
│                     │                   │          │          │            │     }                                            │
│                     │                   │          │          │            │ ]                                                │
│                     │                   │          │          │            │ Cleared By: 0fa4319d-3173-4918-93aa-4b064d46a3c2 │
│                     │                   │          │          │            │ Cleared Time: 06/21/2020 14:41:59 PDT            │
╘═════════════════════╧═══════════════════╧══════════╧══════════╧════════════╧══════════════════════════════════════════════════╛

C:\Users\Administrator\Desktop\sdwan_prog_lab>
Step-4
In Cisco SD-WAN solution components (controllers and vEdge routers) sends various events to vManage. On vManage, these events go through the Alarms Engine which correlates the events and then triggers alarms.
For example, when Control Connection goes down, SD-WAN Manager receives the control connection state change events from controllers and vEdge routers. The alarms engine co-relates these events and then triggers the Control TLOC Down/Up alarm, respectively.
Using the API end point /alarms/uuid/<uuid-value> you can retrieve the details of all the consumed events that have triggered a specific alarm.
Now let's run the script py -3.7 alarms_apis.py alarm-details --uuid <uuid-value> to retrieve the consumed events for a given alarm with a provided uuid value.
Copy the uuid-value of any alarm from the output in Step-3.
Sample Response
Use --help option to see the supported inputs specific command option.
C:\Users\Administrator\Desktop\sdwan_prog_lab>py -3.7 alarms_apis.py alarm-details --help
Usage: alarms_apis.py alarm-details [OPTIONS]

  Retrieve consumed event details for provided alarm uuid.
  Example command: ./alarms_apis.py alarm-details --uuid <alarm uuid value>

Options:
  --uuid TEXT  Alarm uuid
  --help       Show this message and exit

C:\Users\Administrator\Desktop\sdwan_prog_lab>
Sample output of consumed events for the alarm with uuid value dfdd7822-6c19-49f3-844b-47402ff1d616.
C:\Users\Administrator\Desktop\sdwan_prog_lab>py -3.7 alarms_apis.py alarm-details --uuid dfdd7822-6c19-49f3-844b-47402ff1d616

Retrieving the consumed events for uuid dfdd7822-6c19-49f3-844b-47402ff1d616

╒═════════════════════╤═══════════════════╤══════════╤══════════╤════════════════════════════════════════════════════════════╕
│ Date and time (PDT)   │ Alarm tag         │ Active   │ Viewed   │ Consumed events                                            │
╞═════════════════════╪═══════════════════╪══════════╪══════════╪════════════════════════════════════════════════════════════╡
│ 06/21/2020 14:41:42 │ Control_TLOC_Down │ False    │ False    │ [                                                          │
│                     │                   │          │          │     {                                                      │
│                     │                   │          │          │         "builtBy": "EventDataCollector",                   │
│                     │                   │          │          │         "component": "Control",                            │
│                     │                   │          │          │         "entry_time": 1592775645000,                       │
│                     │                   │          │          │         "eventCreationTime": 1592775642877,                │
│                     │                   │          │          │         "eventId": "256a6b8a-c84e-41ec-b339-0e7707293ba8", │
│                     │                   │          │          │         "eventname": "control-connection-state-change",    │
│                     │                   │          │          │         "host-name": "vSmart-2",                           │
│                     │                   │          │          │         "linkupdate": true,                                │
│                     │                   │          │          │         "new-state": "down",                               │
│                     │                   │          │          │         "peer-system-ip": "10.3.0.1",                      │
│                     │                   │          │          │         "peer-type": "vedge",                              │
│                     │                   │          │          │         "peer-vManage-system-ip": "0.0.0.0",               │
│                     │                   │          │          │         "personality": "vsmart",                           │
│                     │                   │          │          │         "public-ip": "100.64.2.2",                         │
│                     │                   │          │          │         "public-port": "5079",                             │
│                     │                   │          │          │         "receive_time": 1592775642867,                     │
│                     │                   │          │          │         "remote-color": "biz-internet",                    │
│                     │                   │          │          │         "severity-level": "major",                         │
│                     │                   │          │          │         "src-color": "default",                            │
│                     │                   │          │          │         "system-ip": "22.22.22.22",                        │
│                     │                   │          │          │         "uptime": "1:19:48:29",                            │
│                     │                   │          │          │         "vManage-system-ip": "22.22.22.22"                 │
│                     │                   │          │          │     },                                                     │
│                     │                   │          │          │     {                                                      │
│                     │                   │          │          │         "builtBy": "EventDataCollector",                   │
│                     │                   │          │          │         "component": "Control",                            │
│                     │                   │          │          │         "entry_time": 1592775646000,                       │
│                     │                   │          │          │         "eventCreationTime": 1592775642871,                │
│                     │                   │          │          │         "eventId": "00c506f5-6d4e-4a5b-9c9f-5b83468edd81", │
│                     │                   │          │          │         "eventname": "control-connection-state-change",    │
│                     │                   │          │          │         "host-name": "vSmart-1",                           │
│                     │                   │          │          │         "linkupdate": true,                                │
│                     │                   │          │          │         "new-state": "down",                               │
│                     │                   │          │          │         "peer-system-ip": "10.3.0.1",                      │
│                     │                   │          │          │         "peer-type": "vedge",                              │
│                     │                   │          │          │         "peer-vManage-system-ip": "0.0.0.0",               │
│                     │                   │          │          │         "personality": "vsmart",                           │
│                     │                   │          │          │         "public-ip": "100.64.2.2",                         │
│                     │                   │          │          │         "public-port": "5079",                             │
│                     │                   │          │          │         "receive_time": 1592775642853,                     │
│                     │                   │          │          │         "remote-color": "biz-internet",                    │
│                     │                   │          │          │         "severity-level": "major",                         │
│                     │                   │          │          │         "src-color": "default",                            │
│                     │                   │          │          │         "system-ip": "12.12.12.12",                        │
│                     │                   │          │          │         "uptime": "1:19:48:30",                            │
│                     │                   │          │          │         "vManage-system-ip": "12.12.12.12"                 │
│                     │                   │          │          │     }                                                      │
│                     │                   │          │          │ ]                                                          │
╘═════════════════════╧═══════════════════╧══════════╧══════════╧════════════════════════════════════════════════════════════╛

C:\Users\Administrator\Desktop\sdwan_prog_lab>
Step-5
Once alarms are consumed/reviewed by the network operations team, we can mark those alarms as viewed and filter them in the response for subsequent API calls used to poll the alarms.
In order to mark an alarm as viewed, run the POST request to API end point /alarms/markviewed with POST below payload request.
{
    "uuid" : <list of alarm uuids to be marked as viewed>
}
Sample Response
Use --help option to see the supported inputs specific command option i.e. py -3.7 alarms_apis.py ack-alarm --help
C:\Users\Administrator\Desktop\sdwan_prog_lab>py -3.7 alarms_apis.py ack-alarm --help
Usage: alarms_apis.py ack-alarm [OPTIONS]

  Acknowledge specific alarms of provided uuids.
  Example command: ./alarms_apis.py ack-alarm --uuid <alarm uuid value>
  To ack multiple uuids seperate uuid using "," i.e. --uuid uuid-1,uuid-2

Options:
  --uuids TEXT  Alarm uuid/s
  --help        Show this message and exit.

C:\Users\Administrator\Desktop\sdwan_prog_lab>
Now let's run the script py -3.7 alarms_apis.py ack-alarm --uuids dfdd7822-6c19-49f3-844b-47402ff1d616 to mark the specific alarm as viewed or acknowledged.
Sample Response
C:\Users\Administrator\Desktop\sdwan_prog_lab>py -3.7 alarms_apis.py ack-alarm --uuids dfdd7822-6c19-49f3-844b-47402ff1d616
Acknowledged the alarms with uuid ['dfdd7822-6c19-49f3-844b-47402ff1d616']

C:\Users\Administrator\Desktop\sdwan_prog_lab>
Step-6
At a Windows command prompt run the script py -3.7 alarms_apis.py list-alarms --alarm_tag Control_TLOC_Down to confirm that acknowledged alarm is now not seen in the response from the SD-WAN Manager Alarms API.
C:\Users\Administrator\Desktop\sdwan_prog_lab>py -3.7 alarms_apis.py list-alarms --alarm_tag Control_TLOC_Down

Retrieving the alarms with tag Control_TLOC_Down

╒═════════════════════╤═════════════╤══════════╤══════════╤════════════╤═══════════╕
│ Date & Time (PDT)   │ Alarm tag   │ Active   │ Viewed   │ Severity   │ Details   │
╞═════════════════════╪═════════════╪══════════╪══════════╪════════════╪═══════════╡
╘═════════════════════╧═════════════╧══════════╧══════════╧════════════╧═══════════╛

C:\Users\Administrator\Desktop\sdwan_prog_lab>
Note: You would see a different output based on the alarms reported in SD-WAN Manager of your dcloud setup.
Conclusion
In this section you learned how to build a query for different scenarios to retrieve the alarms and how to parse the alarm data from SD-WAN Manager.
Python scripts used in this lab
alarm_apis.py vmanage_apis.py vmanage_config_apis.py monitor-app-route-stats.py requirements.txt