Cisco Cloud Security App for Splunk
The Cisco Cloud Security App for Splunk is an on-line application that integrates with the Splunk data platform. The app provides dashboards, alert actions, research capabilities, and management of Cisco Secure Access and Cisco Umbrella resources. The Cisco Cloud Security App for Splunk combines the data from the Cisco Cloud Security APIs and events that you add from the Cisco Cloud Security Add-On for Splunk.
Splunk is a robust Security Information and Event Management (SIEM) platform. Splunk provides anomaly detection, incident forensics, and vulnerability management. For more information, see Cisco Splunk.
The Cisco Cloud Security App for Splunk's dashboards display cloud security key performance indicators (KPIs), outliers, and trends. The app provides the option to explore granular data obtained through the integration with the Cloud Security Add-On for Splunk. The app enables both detection and mitigation response of security events. Security operation center (SOC) teams and threat hunters have the ability to manage destinations and gain insights into the destinations that are accessed by the user devices on the organization's networks.
From the app, you can manage incidents with access to applications through the cloud access security broker (CASB) in Cisco Cloudlock. You can also use the app to research destinations with Cisco Investigate and create and export detailed reports about destinations and related information.
The Cisco Cloud Security App for Splunk is available at,
https://splunkbase.splunk.com/app/5558/
What's New
The latest version of the Cisco Cloud Security App for Splunk is 1.0.50.
Updates to the Cisco Cloud Security App for Splunk
- Added the API Usage dashboard.
- On the main menu in the app, added a tab that links directly to the Cisco Cloud Security Add-On for Splunk.
About the Apps Menu
From the Apps Menu in your instance of Splunk, you can navigate to the Cisco Cloud Security App.
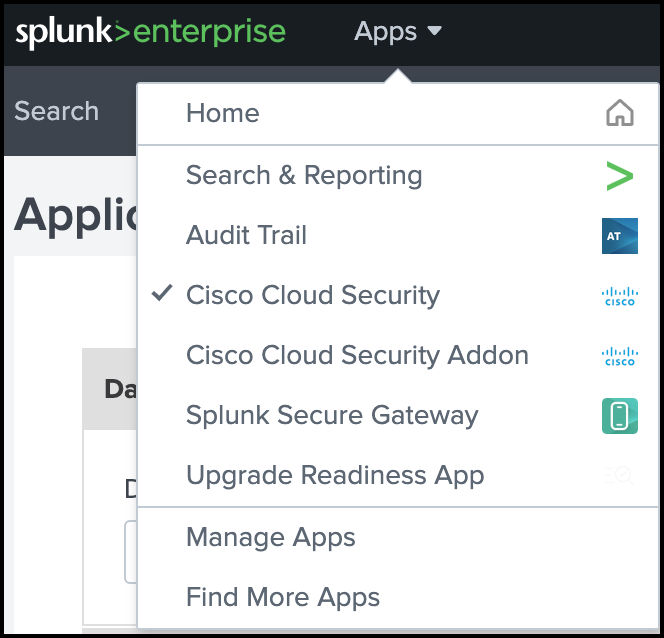
In your instance of Splunk, locate the Splunk navigation bar, click Apps, and then select Cisco Cloud Security.
The Cisco Cloud Security App includes:
- Search
- Overview
- Monitor
- Applications
- Access
- Investigate
- Application Settings
About the Dashboards
You can set up the dashboards in the Cloud Security App for Splunk to display the organization's cloud security events and log data.
- Overview Dashboards
- Monitor: Cloud Security Dashboards
- Applications Dashboards
- Access Dashboards
- Investigate Dashboard
- Cloudlock Dashboard
- API Usage Dashboard
Overview Dashboards
- Total Requests
- Total Blocks
- Security Blocks
- Application Discovery
- Destination Lists
- Cloudlock Incidents
Monitor: Cloud Security Dashboards
- DNS
- DNS Requests
- Blocked versus Allowed Destinations
- DNS Blocked Categories (Top 10)
- Secure Web Gateway (SWG)
- SWG Requests
- Blocked versus Allowed Destinations
- SWG Blocked Categories (Top 10)
- Cloud-Delivered Firewall (CDFW)
- CDFW Requests
- Blocked versus Allowed Destinations
- Destination Lists
- Destinations Trend
- Removed Destinations
- Data Layer Protection (DLP).
- Configure the DLP log data with the Cisco Cloud Security Add-On for Splunk.
Applications Dashboards
- App Discovery
- Private Resources Overview
- Private Resources Details
Access Dashboards
- Remote Access Virtual Private Network (RAVPN)
- Zero Trust Network Access (ZTNA)
Investigate Dashboard
- Investigate
- Triggered Investigations
- Reports
Cloudlock Dashboard
- Incidents and other event data for applications that are managed and monitored by Cisco Cloudlock.
API Usage Dashboard
- Reports on the usage of the Secure Access APIs in the Cisco Cloud Security Add-On for Splunk and Cisco Cloud Security App for Splunk.
Get Started – Set Up the Cloud Security App
The Cloud Security App for Splunk guide describes how to download, install, configure, display data, and create alert actions on the app.
- Create an API key and secret in Umbrella or Secure Access, and optionally get the organization's Cloudlock API access token. For more information, see Prerequisites.
- Download and install the Cloud Security App for Splunk in your instance of Splunk. For more information, see Download and Install the Cloud Security App.
- (Optional) Download and install the Cloud Security Add-On for Splunk in your instance of Splunk. For more information, see Download and Install the Cloud Security Add-On.
- Configure the Cloud Security application settings in the app. For more information, see Configure Cloud Security Application Settings.
- (Optional) Configure alerts and reports on the app. For more information, see Manage Alert Actions.
Walkthrough: Cloud Security App for Splunk
Prerequisites
- An instance of Cisco Splunk Enterprise or Cisco Splunk Cloud that supports Splunk platform versions 9.4.x or 9.3.x.
- A subscription for at least one of the Cisco Cloud Security products: Cisco Secure Access, Cisco Umbrella, Cisco Investigate, or Cisco Cloudlock.
- A valid Secure Access API key and secret. For more information, see Secure Access API Authentication.
- A valid Umbrella API key and secret. For more information, see Umbrella API Authentication.
- A valid Cloudlock API access token and URI. For more information, see Cloudlock Authentication.
- Administrative privileges for your instance of Splunk.
Note: You can not use the Cisco Cloud Security App for Splunk with the Splunk Free license.
Create an API Key with the Required OAuth 2.0 Scopes
To get the organization's cloud security data integrated with the app, create an Umbrella or Secure Access API key with the required OAuth 2.0 scopes. For information about the Umbrella API key scopes, see Umbrella OAuth 2.0 Scopes. For information about the Secure Access API key scopes, see Secure Access OAuth 2.0 Scopes.
- For the Reporting API, add the Reports > Aggregations (Read-only) key scope on the API key:
reports.aggregations:read
- For the Destination Lists API, add the Policies > Destination Lists (Read/Write) and Policies > Destinations (Read/Write) key scopes on the API key:
policies.destinationlists:writepolicies.destinations:write
- For the App Discovery API, add the Reports > App Discovery (Read/Write) key scope on the API key:
reports.appDiscovery:write
- For the Investigate API, add the Investigate > Investigate (Read-only) and Investigate > InvestigateBulk (Read-only) key scopes on the API key:
investigate.investigate:readinvestigate.bulk:read
Download and Install the Cloud Security App
- Navigate to Splunkbase at
https://splunkbase.splunk.com/, and then search for Cisco Cloud Security, or navigate tohttps://splunkbase.splunk.com/app/5558/. - Download the latest Cisco Cloud Security App for Splunk software package (
cisco-cloud-security-1.0.50.tar.gz). - Install the Cisco Cloud Security App for Splunk on your instance of Cisco Splunk Enterprise or Cisco Splunk Cloud.
- Restart your Splunk instance to complete the installation of the app.
Install the Cloud Security App in Distributed Deployments
You can install the Cloud Security App for Splunk in a distributed deployment of Splunk Enterprise, or any deployment where you use forwarders to retrieve your data. Depending on your environment and preferences, and the requirements of the app, you can install the app in multiple environments.
We recommend that you install the app using the Splunk search heads and Splunk indexers.
| Splunk Platform Component | Support |
|---|---|
| Search Heads | Install and configure only the Destination Lists and S3 indexes. |
| Indexers | Install and configure only the Investigate and Cloudlock APIs and indexes. |
Role-Based Access Controls in the App
The Cisco Cloud Security App for Splunk creates roles for use in the dashboard views and the Application Settings view.
| Role | Permissions |
|---|---|
| cs_admin |
|
| cs_supervisor |
|
| cs_user |
|
Upgrade the Cloud Security App
In your instance of Splunk, locate the Splunk navigation bar, click Apps, and then select Manage Apps.
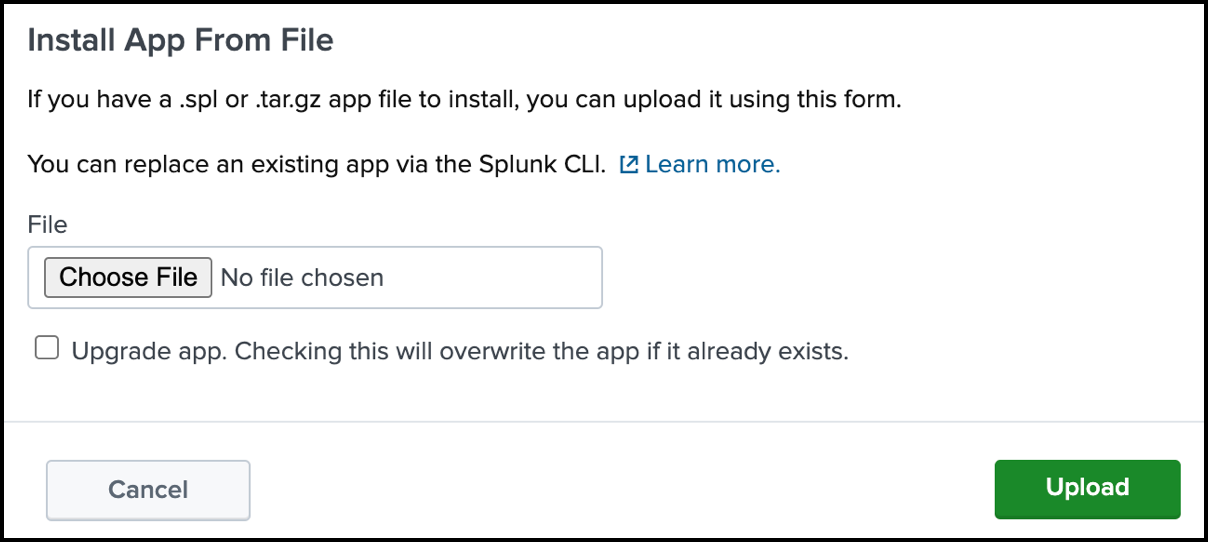
Click Install App From File.
Click Choose File, and then select the software package for the Cisco Cloud Security App for Splunk that you downloaded previously.
Check Upgrade app, choose the zipped tar file, then click Upload.
Configure Application Settings
In your instance of Splunk, locate the Splunk navigation bar, click Apps, and then select Cisco Cloud Security.
Navigate to Application Settings, and then set up the Cloud Security App.

- Configure the general dashboard settings in the app. For more information, see Add General Dashboard Settings.
- Add the Secure Access or Umbrella API credentials and settings, including the Investigate and App Discovery Index settings. For more information, see Add Secure Access or Umbrella API Settings.
- Manage Destination Lists. For more information, see Manage Destination Lists.
- Add the Cloudlock API access token and configure the data retrieval and index settings. For more information, see Add Cloudlock Settings.
- Configure the Log Index settings. Choose the inputs on the app to search for event data in the Secure Access or Umbrella logs. For more information, see Add Log Index Settings.
Add General Dashboard Settings
Select the default search interval and the panel refresh rate for the app.
Navigate to Dashboard Settings.
Choose a Default Search Interval and Panel Refresh Rate.
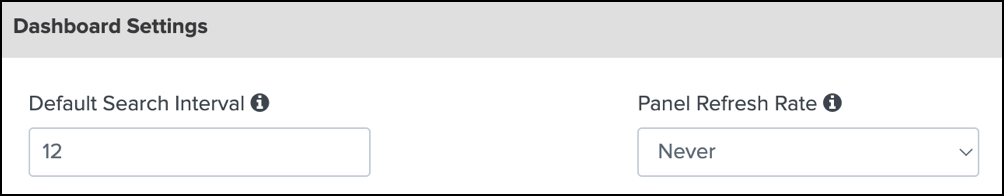
- For Default Search Interval, enter an integer. When first installed, the app sets the Default search interval to
1.- If you upgrade the app, you must configure the Default search interval to ensure that the calendar dates align with your instance of Splunk.
- If you update the Default Search Interval, we recommend that you clear your browser cache.
- For Panel Refresh Rate, choose how often the app refreshes your dashboard view.
- For Default Search Interval, enter an integer. When first installed, the app sets the Default search interval to
Click Save.
Add Secure Access or Umbrella API Settings
Add the Secure Access or Umbrella API Key credentials, configure the timezone and storage region, and set up the App Discovery and Investigate index settings.
Navigate to Cisco Secure Access/Umbrella API Settings.
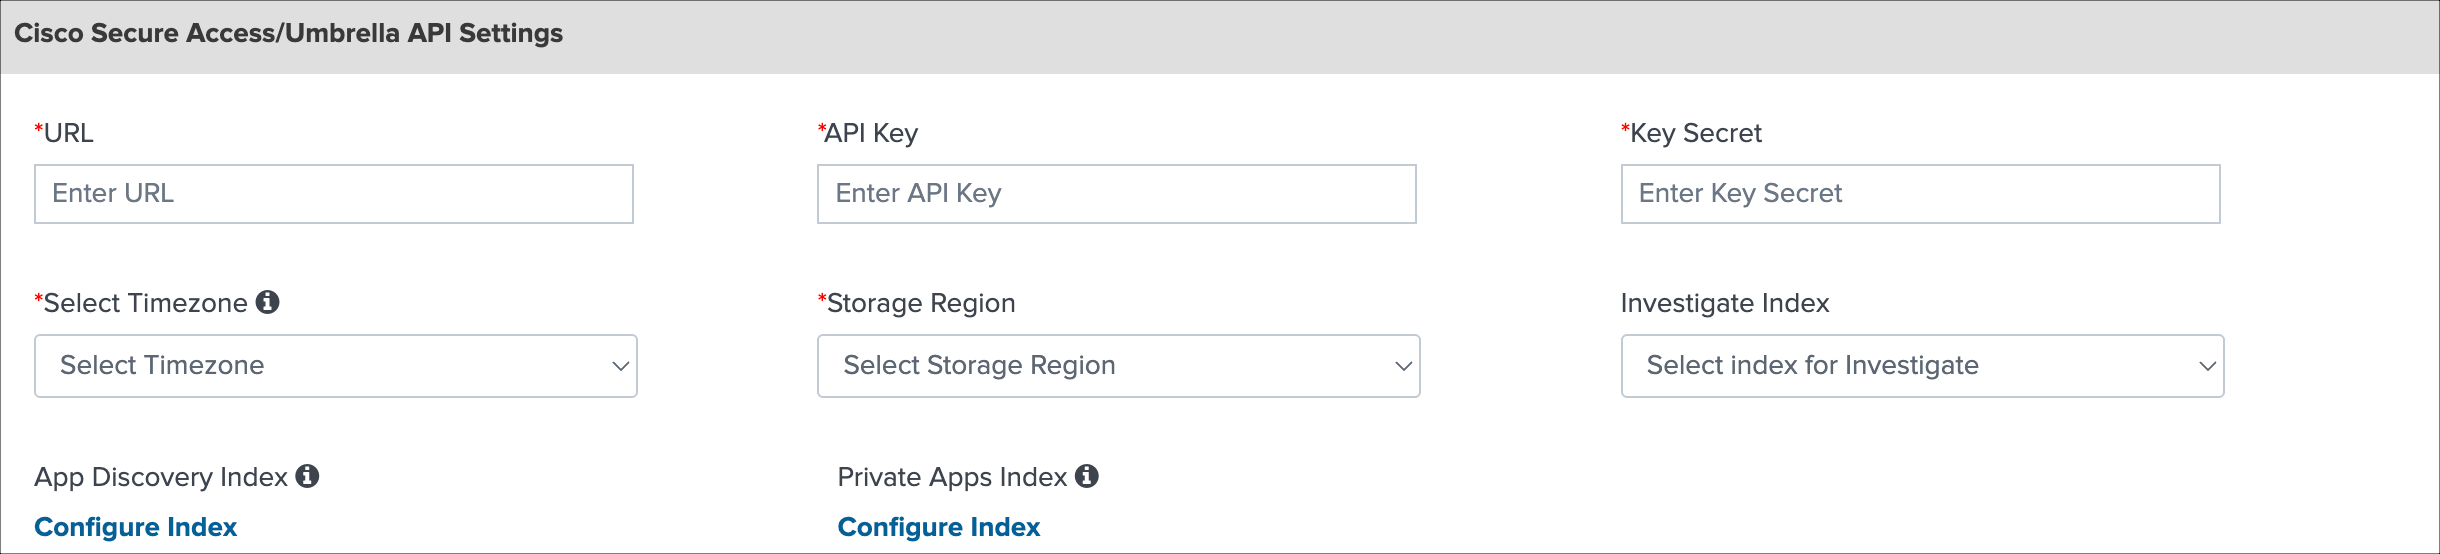
For URL, enter the Secure Access API URL:
https://api.sse.cisco.comor the Umbrella API URL:https://api.umbrella.com.For API Key, enter your Secure Access or Umbrella API key ID.
For Key Secret, enter your Secure Access or Umbrella API key secret.
For Select Timezone, choose the timezone where you are running the app.
For Storage Region, choose the location of your storage region.
For Investigate Index, select an index for the Investigate data.
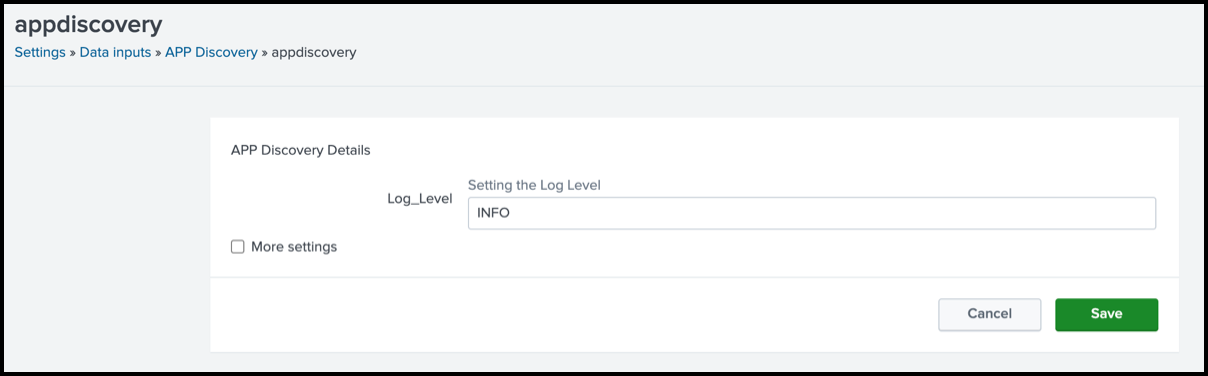
For App Discovery Index, click Configure Index.
(Optional) Enter the App Discovery log level, and then click Save.
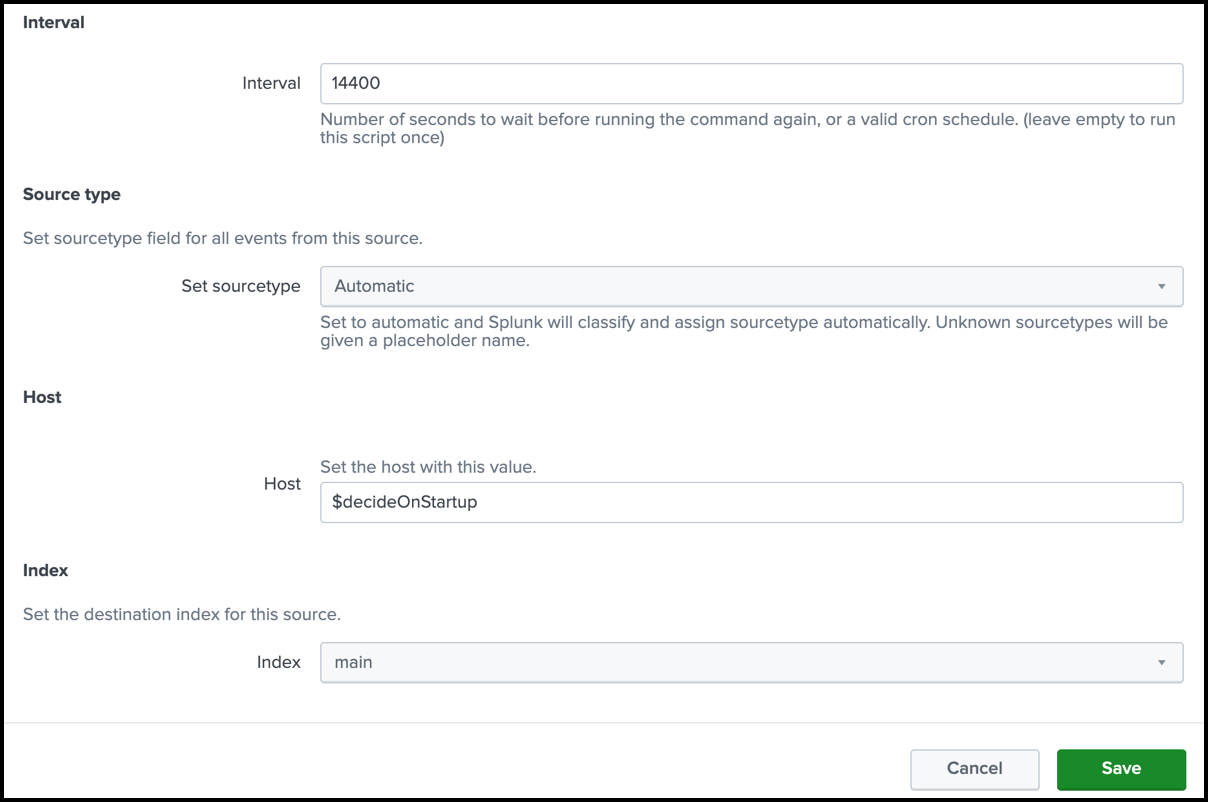
(Optional) Click More settings, add the App Discovery Interval, Source type, Host, and Index, and then click Save.
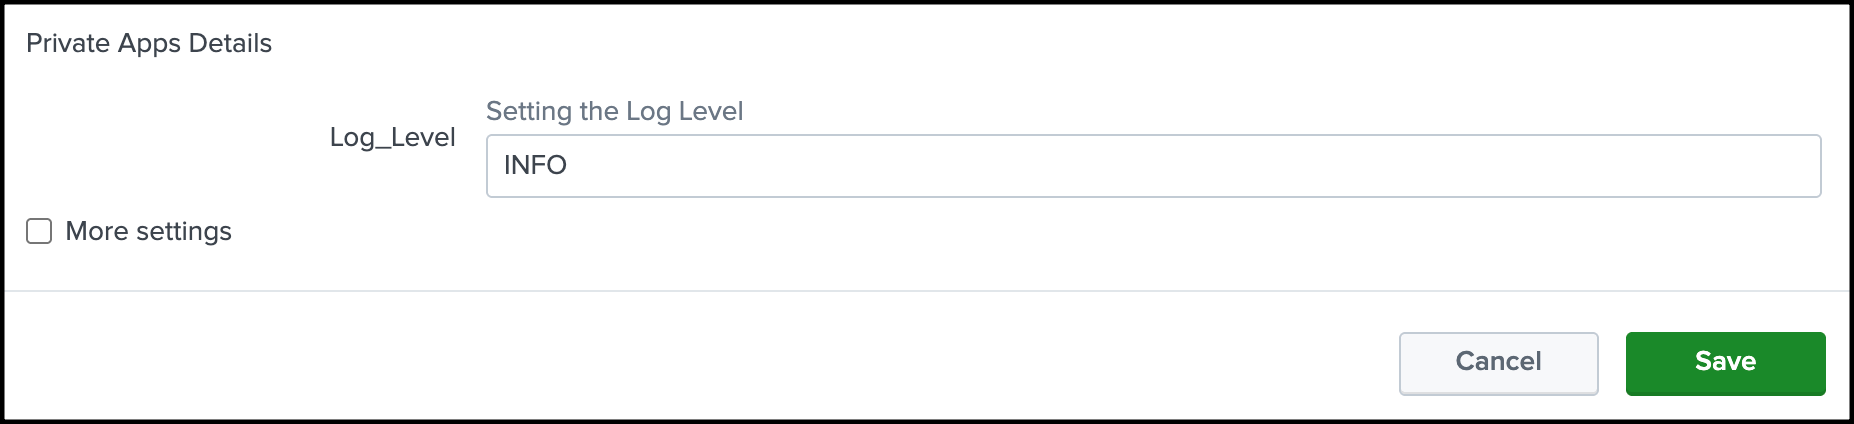
For Private Apps Index, click Configure Index.
(Optional) Enter the Private Apps log level, and then click Save.
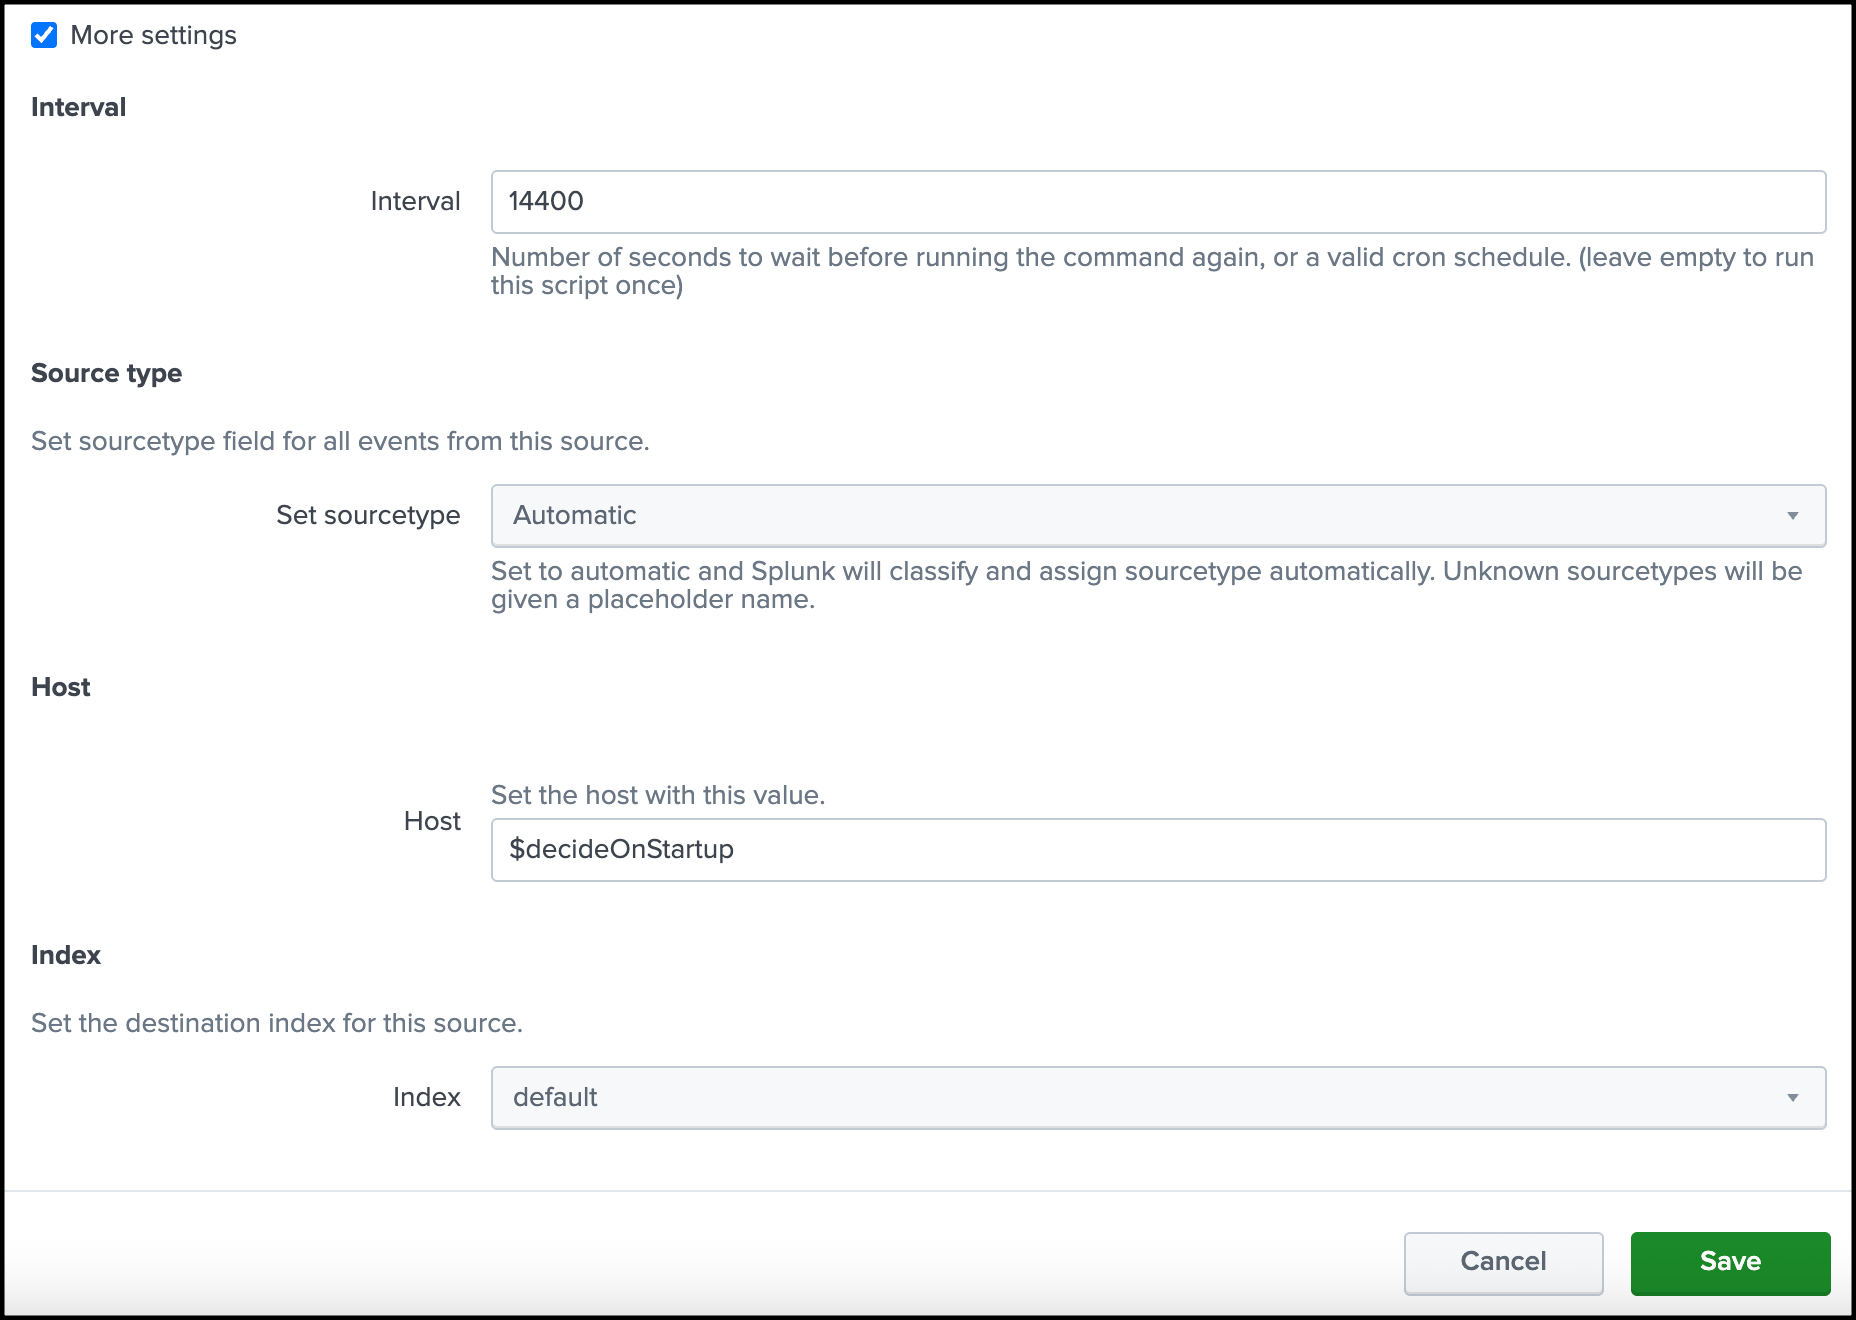
(Optional) Click More settings, add the Private Apps Interval, Source type, Host, and Index, and then click Save.
Click Save.
Manage Destination List Settings
You can fetch all of the destination lists in the organization for the users of the app or choose specific destination lists from the organization to add in the app.
Note: Before you can fetch the destination lists in the organization, add the Secure Access or Umbrella API key credentials in the app. For more information, see Add Secure Access or Umbrella API Settings.
Navigate to Destination List Settings.
Click Fetch Destination Lists. The app displays all destination lists (Secure Access or Umbrella) in the organization.
For each configured Splunk role, add the destination lists to the app. Use the redirection and filter icons to add or remove destination lists in the app.
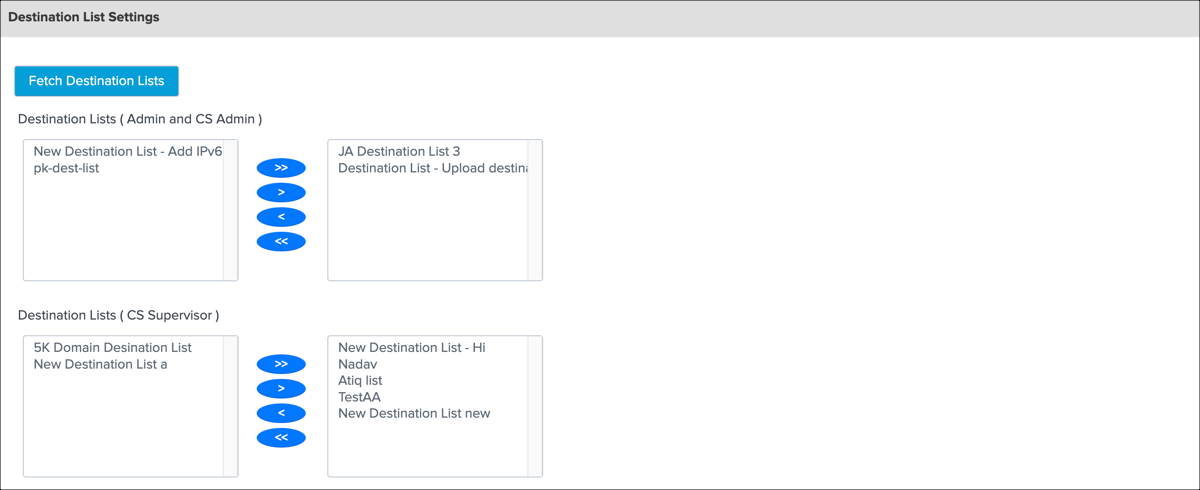
Click Save.
Add Cloudlock Settings
Add the Cloudlock API Key credentials and configure the settings for the Cloudlock data.
Navigate to Cloudlock Settings.
For Config Name, enter a meaningful name.
Obtain your Cloudlock URL from Cisco Cloudlock Support, and then add to URL.
Sample Cloudlock URL:
https://YourEnvironmentsAddress.cloudlock.com/api/v2Generate your Cloudlock API token in Cloudlock, and then add to Token. For more information, see Cloudlock API Authentication.
Choose Retrieve event/entity raw data to view event information about your incidents.
Choose Show Cisco CASB incident UEBA panels to view the UEBA panels.
Choose a Start Date. When Start Date is blank, the app fetches incidents for the last seven days. We recommend that you do not set a start date that is older than one month. A start date older than one month causes the app to fetch large amounts of data.
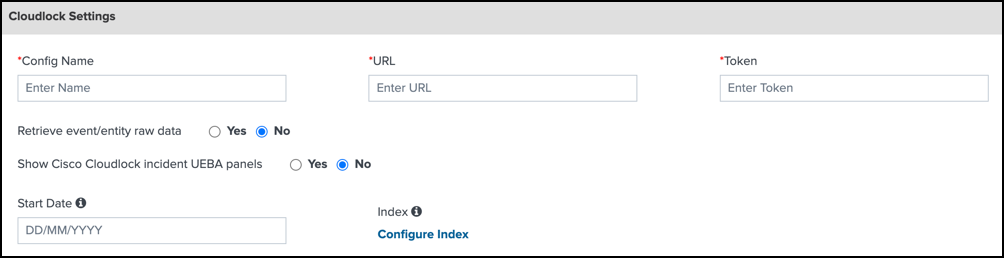
Click Save.
Add Log Index Settings
To configure the Log Index Settings, you must install the Cloud Security Add-On for Splunk in your instance of Splunk. For more information, see Create New Inputs for Umbrella and Create New Inputs for Secure Access.
Navigate to Umbrella Log Index Settings.
Choose the appropriate index for each event type to connect the inputs.
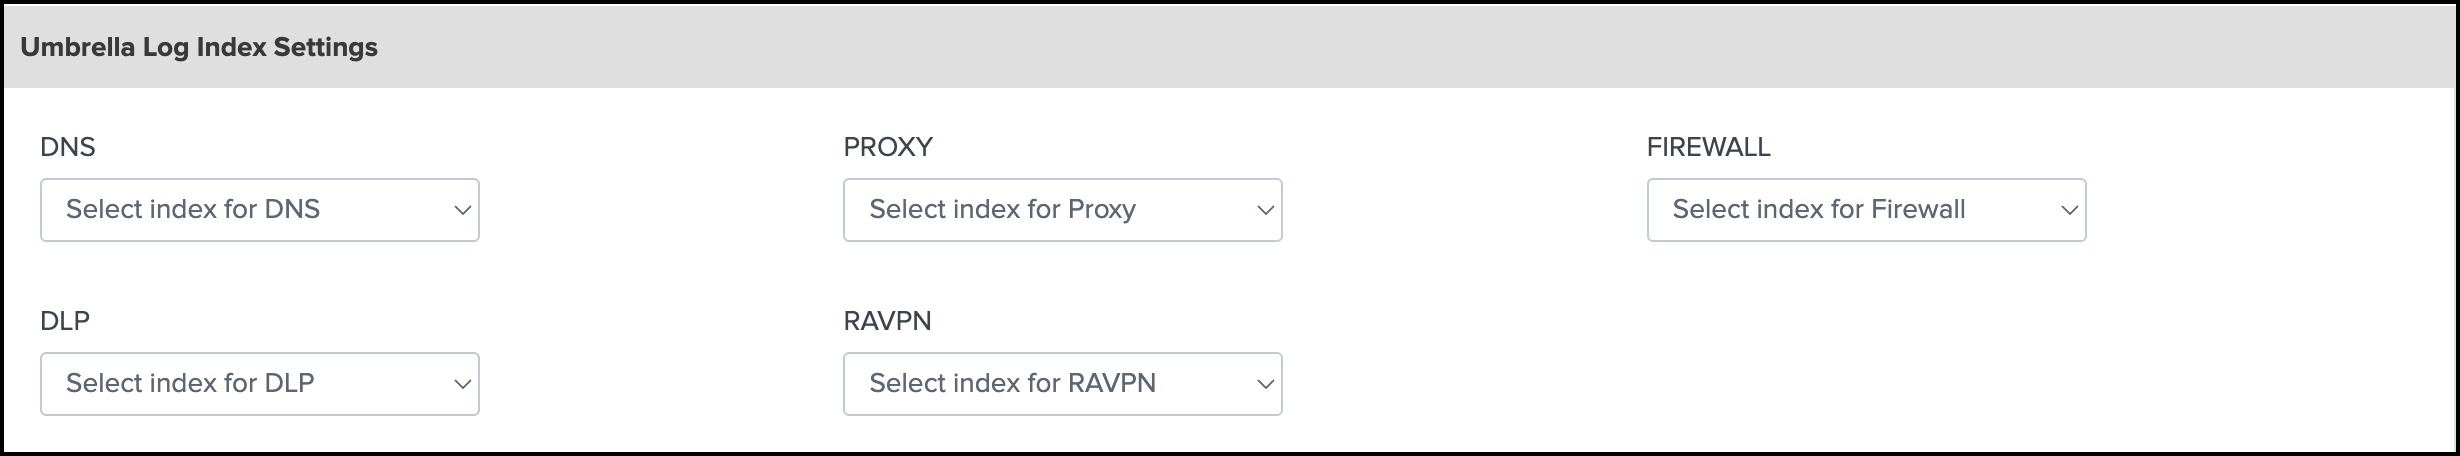
Click Save.
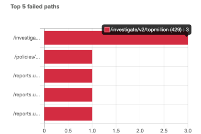
View API Usage Dashboard
The API Usage dashboard shows the top ten APIs requested and a summary of the API requests in the add-on and app.
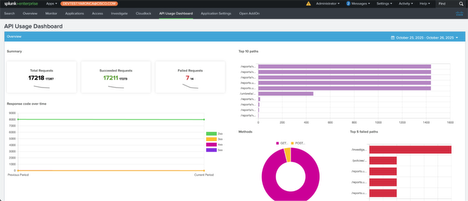
The API Usage dashboard shows the top five APIs requested where the request failed, which may indicate that the number of API requests is above the rate limits for an API or that too many updates to a resource occurred that were unintended.
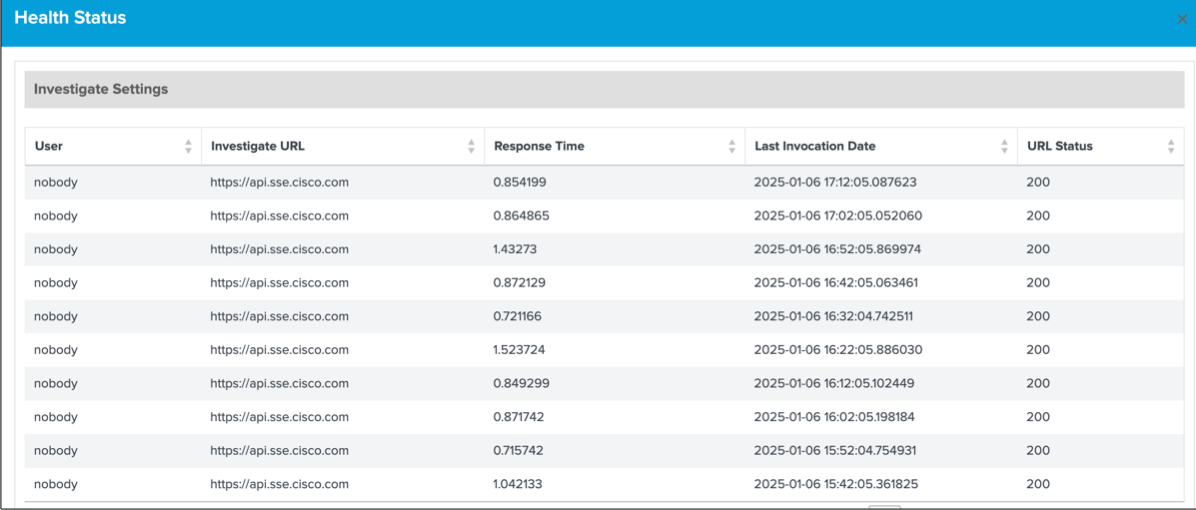
View Configured Application Settings and API Health Status
After you configure the Application Settings in the app, you can view the history of the configured settings and health status of each configured Cloud Security API.
Navigate to Application Settings.
Click View History. The app displays the history of the application settings.
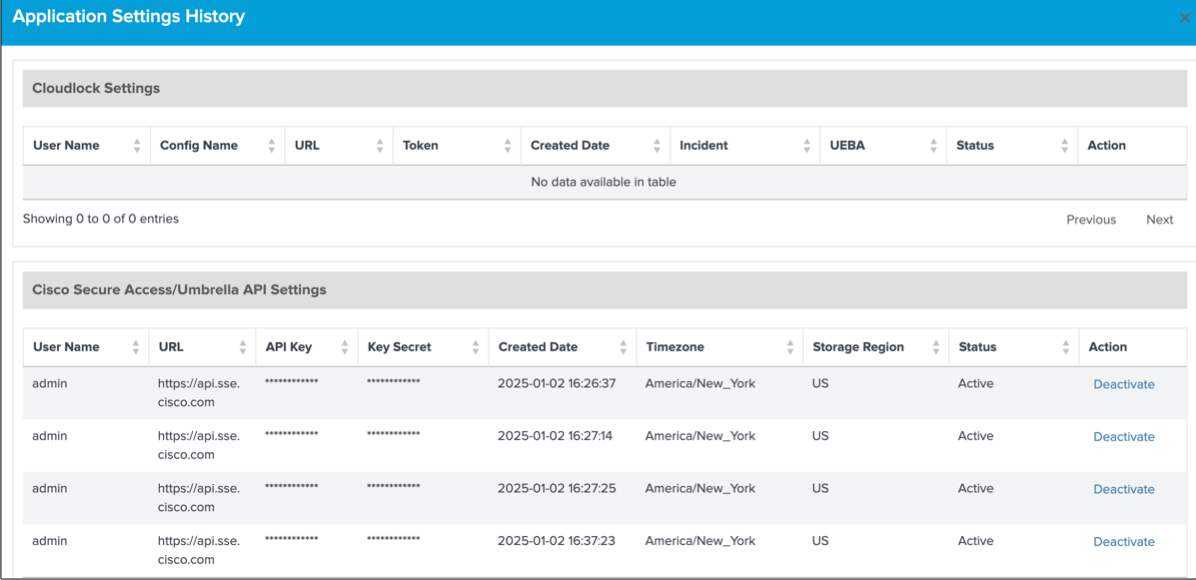
Click Health Status. The app displays the status of the Cloud Security APIs, which are integrated with the app.
Check Splunk Indexes
Check that Splunk receives events from Umbrella or Secure Access and applies the configured indexes. Query for the type of cloud security data to view the indexed events.
For example:
- Navigate to the Search tab.
- Enter
sourcetype = cisco:umbrella:dnsin Cisco Umbrella DNS Logs—View Umbrella DNS events. - Enter
sourcetype = cisco:umbrella:proxyin Cisco Umbrella Proxy Logs—View Umbrella Secure Web Gateway (proxy) events. - Enter
sourcetype = cisco:umbrella:firewallin Cisco Umbrella Firewall Logs—View Umbrella Firewall events. - Enter
sourcetype = cisco:umbrella:auditin Cisco Umbrella Audit Logs—View Umbrella Audit events. - Enter
sourcetype = cisco:umbrella:dlpin Cisco Umbrella DLP Logs—View Umbrella DLP events.
Troubleshoot Application Settings
If you encounter errors in the Cloud Security App for Splunk, we recommend that you verify your configured application settings, which includes the Secure Access or Umbrella API key credentials for the organization.
View Overview Dashboards
- Aggregated Requests and Blocks
- Application Discovery
- Destination Lists (Added and Removed Trends)
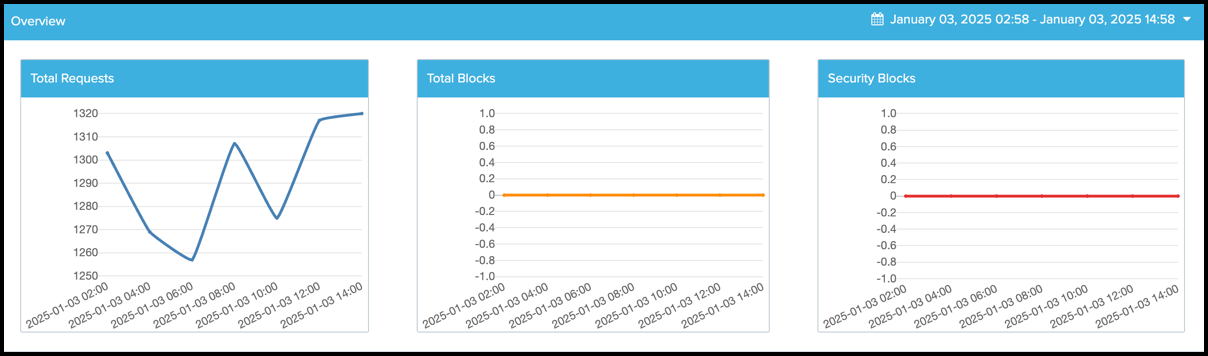
Overview of Aggregated Requests and Blocks
In the app, the Overview page displays a series of dashboards of aggregated Secure Access or Umbrella data:
- Total Requests
- Total Blocks
- Security Blocks
If the Secure Access or Umbrella app modules cannot connect to the Reporting API, the app may not display the aggregated data on the Overview page.
In your instance of Splunk, locate the Splunk navigation bar, click Apps, and then select Cisco Cloud Security.
Navigate to Overview > Overview to view the aggregated data dashboards.
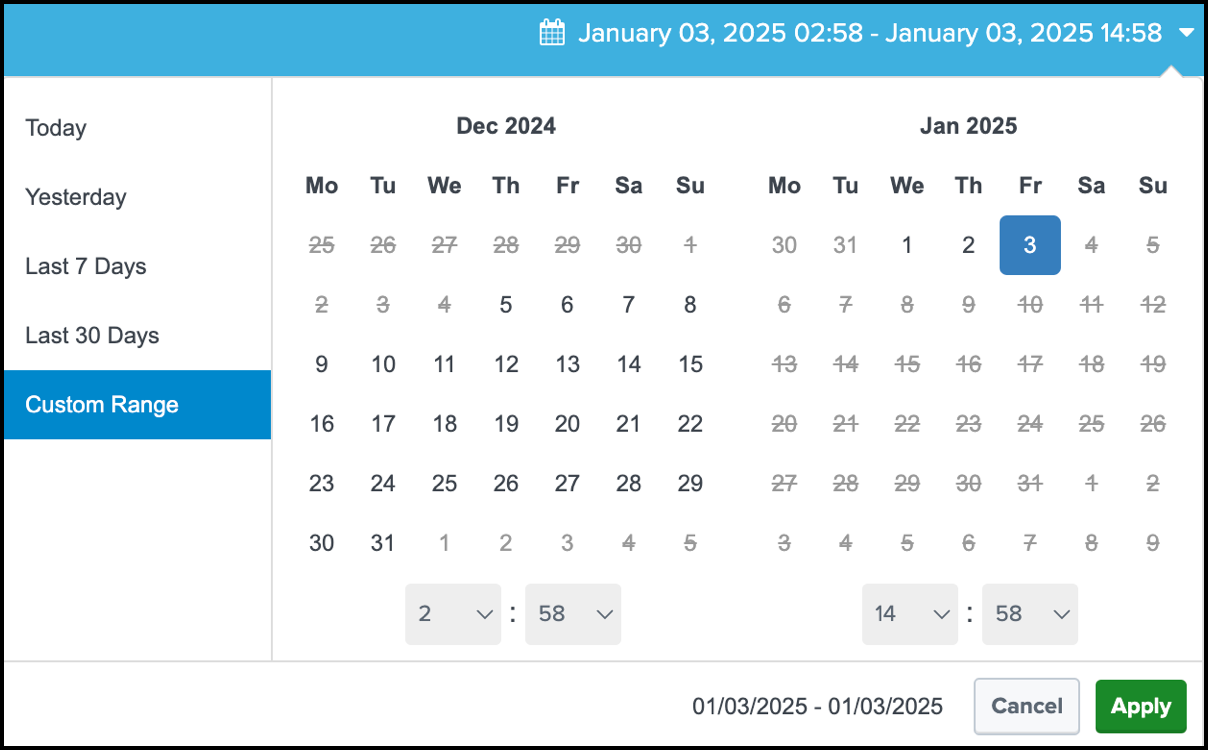
(Optional) Configure the time range for the data. If you do not set a time range, the app displays the data for the Last 1 Hour (last hour).
- (Optional) Choose one of the predefined date ranges, or click Custom to select Custom Date Ranges.
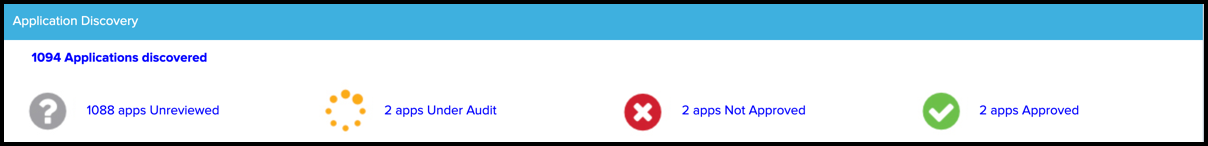
Overview of Application Discovery
In the app, the Overview page displays the aggregated data for the Application Discovery module.
If the Secure Access or Umbrella app modules cannot connect to the Application Discovery API, the app may not display the aggregated data on the Overview page.
- In your instance of Splunk, locate the Splunk navigation bar, click Apps, and then select Cisco Cloud Security.
- Navigate to Overview > App Discovery to view the number of application requests for each application discovery type monitored for the organization.
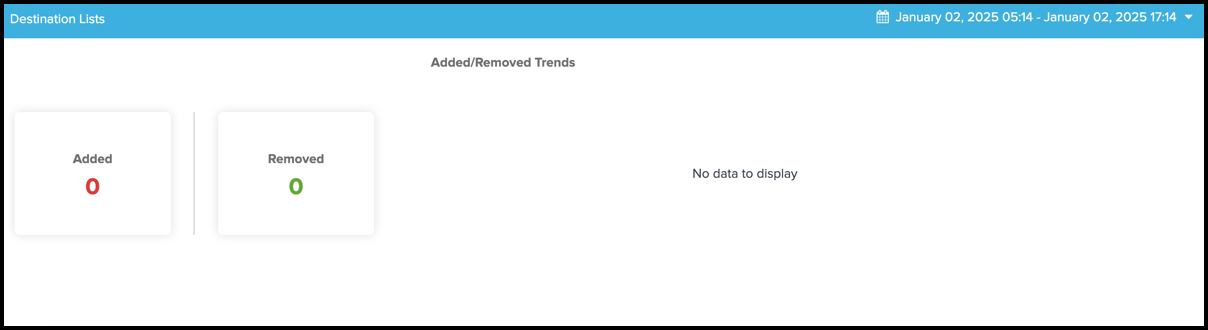
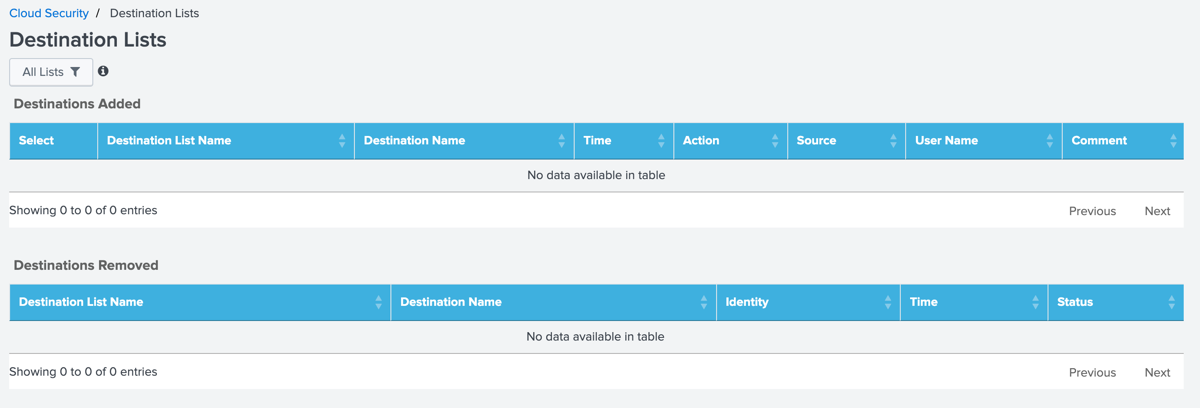
Overview of Destination Lists Added and Removed
In the app, the Overview page displays the destination lists in the app that were added or removed from the organization.
If the Secure Access or Umbrella app modules cannot connect to the Destination Lists API, the app may not display the aggregated data on the Overview page.
- In your instance of Splunk, locate the Splunk navigation bar, click Apps, and then select Cisco Cloud Security.
- Navigate to Overview > Destination Lists to view the number of destination lists that were added and removed in the organization.
View Cloud Security Dashboards
In the app, the Monitor page displays the requests, blocked versus allowed destinations, and blocked categories (Top 10), which depend on the configured Cloud Security log data.
The Monitor page includes the DNS-layer security, Secure Web Gateway (SWG), Cloud-Delivered Firewall (CDFW), and Destination Lists, and Data Layer Protection (DLP) modules.
The Cloud Security data for the individual security modules is available only when the Cisco Cloud Security Add-On is installed and configured. In Application Settings, select the indexes under Umbrella. For more information, see Create New Inputs for Umbrella or Secure Access.
- In your instance of Splunk, locate the Splunk navigation bar, click Apps, and then select Cisco Cloud Security.
- Navigate to Monitor.
- Configure the time range for the data. If you do not set a time range, the app displays the data for the Last 1 Hour (last hour).
- (Optional) Choose one of the predefined date ranges, or click Custom to select Custom Date Ranges.
- Click Apply.
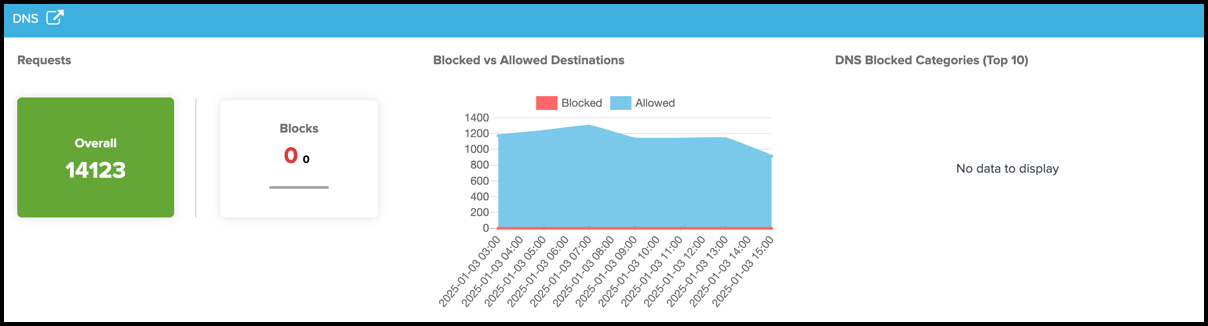
DNS—Displays the total request count and total number of blocks, blocked versus allowed destinations for the specified time, and top blocked DNS categories.
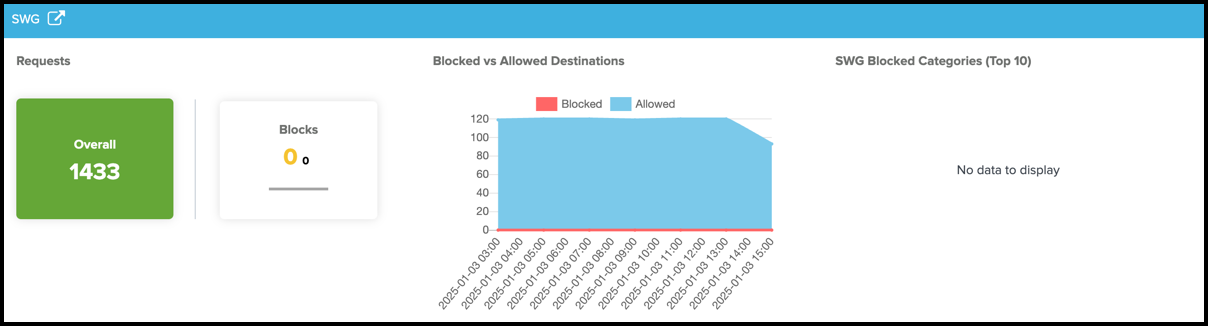
SWG—Displays the total request count and total number of blocks, blocked versus allowed destinations for the specified time, and top blocked proxy categories.
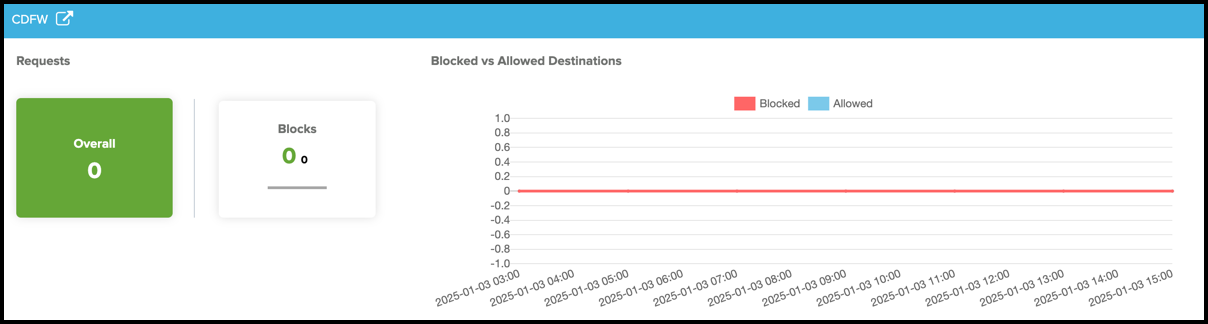
CDFW—Displays the total request count and total number of blocks, and blocked versus allowed destinations for the specified time.
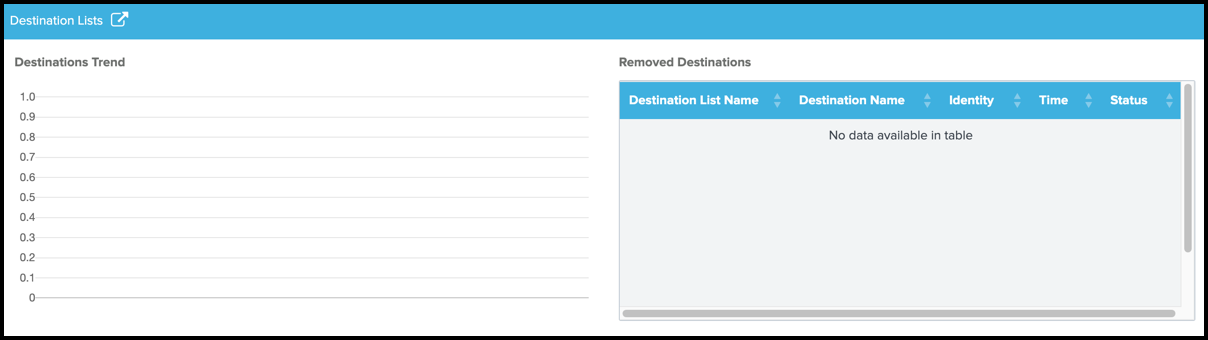
Destination Lists—Displays the number of blocked destinations (Destinations Trend), and destinations that were removed from the destination lists in the organization (Removed Destinations).
DLP—Displays the incidents about applications.
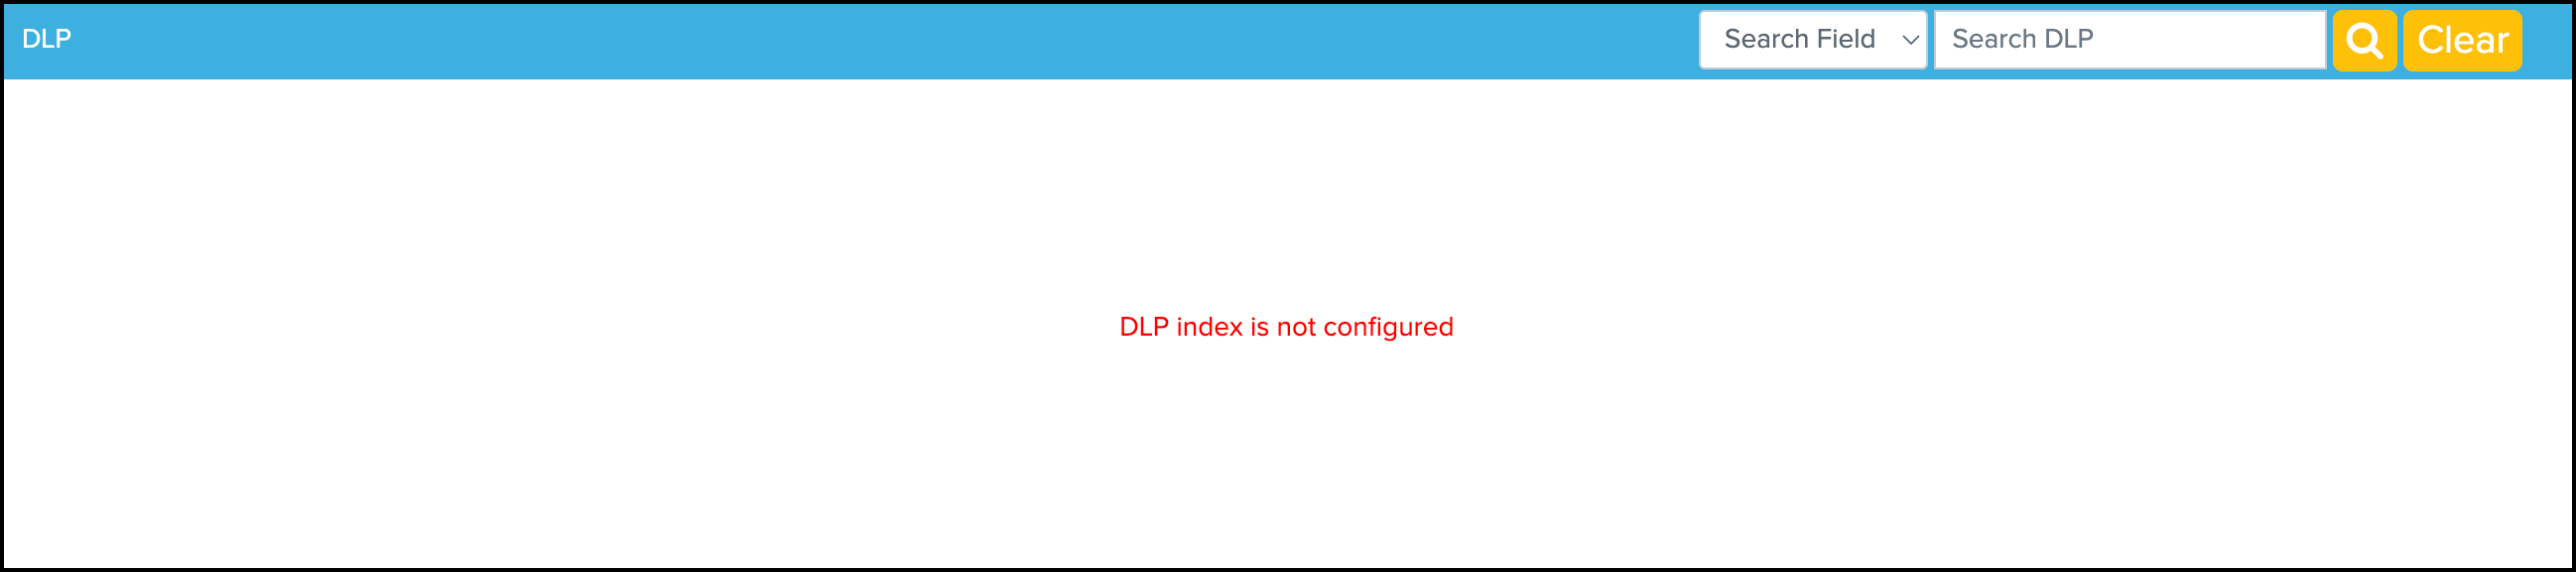
- In your instance of Splunk, locate the Splunk navigation bar, click Apps, and then select Monitor.
- Navigate to DLP.
- For Search Field, choose one of the fields to use when searching for an application.
- (Optional) For Search DLP, enter the name of an application. The application name is used to query the applications that are monitored by Secure Access or Umbrella DLP security.
DNS Details
Click the DNS redirection icon. The app displays the Cloud Security > DNS dashboards for the DNS-layer security.
- Total Security Blocks
- Top 10 Security Blocks
- Malware/BotNet/Phishing Trends
- Command and Control
- Phishing
- Top DNS Blocks by Identity
- Recent 15 Destinations
Configure the time range for the data. If you do not set a time range, the app displays the data for the Last 1 Hour (last hour).
- (Optional) Choose one of the predefined date ranges, or click Custom to select Custom Date Ranges.
SWG Details
Click the SWG redirection icon. The app displays the Cloud Security > SWG dashboards for the security provided by the Secure Web Gateway.
- Total Security Blocks
- Top 10 Security Blocks
- Malware/BotNet/Phishing Trends
- Breakdonw by AMP Verdict
- Breakdown by Mime Types
- Newly Seen Destinations
- Recent 15 Destinations
CDFW Details
Click the CDFW redirection icon. The app displays the Cloud Security > CDFW dashboards for the security provided by the cloud-delivered firewall.
- Total Blocks
- Top Blocked Destination IP
- Block versus Allow Verdict Trend
- Top Identities
- IP Protocol
- Web Port versus Other Port
- Web Port
- Non-Web Port
Destination Lists Details
Click the Destination Lists redirection icon. The app displays the Cloud Security > Destination Lists dashboards for the destination lists in the organization.
Data Layer Protection (DLP) Details
- Click the DLP redirection icon. The app displays the Cloud Security > DLP dashboards.
View Applications Dashboards
The app displays the App Discovery, and Private Resources Overview and Private Resources Details dashboards. The CASB dashboards provide the information about the applications managed by the App Discovery API. The Private Resources dashboards provide the details about the Private Resources and private applications using the Private Resources and Resource Groups API.
App Discovery
View the incidents about applications and related events on the app from the App Discovery reports.
In your instance of Splunk, locate the Splunk navigation bar, click Apps, and then select Cisco Cloud Security.
Navigate to Applications.
For Search Field, choose either Category, Weighted Risk, or Label.
(Optional) For Search App, enter the name of an application. The application name is used to query the applications that are monitored by Secure Access or Umbrella.
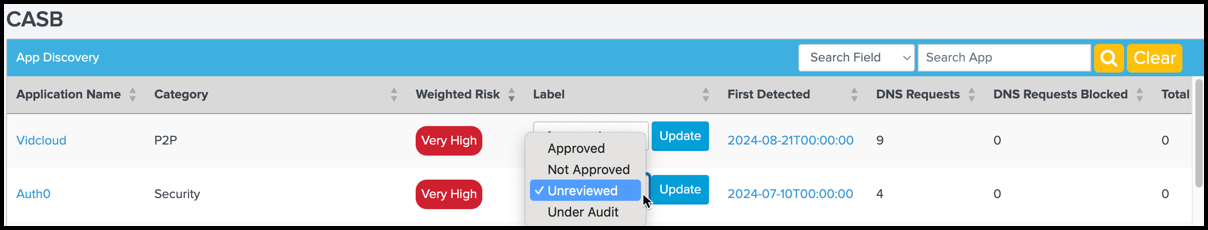
(Optional) Select the label for the application, and then click Update.
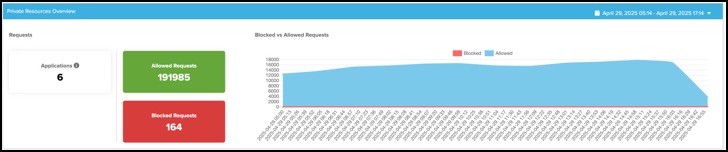
Private Resources Overview
View the incidents for the private applications and related events in the app.
In your instance of Splunk, locate the Splunk navigation bar, click Apps, and then select Cisco Cloud Security.
Navigate to Applications > Private Resources Overview.
View the number of private applications, count of the allowed requests, count of the blocked requests, timeline of the allowed and blocked requests to the private applications in the organization.
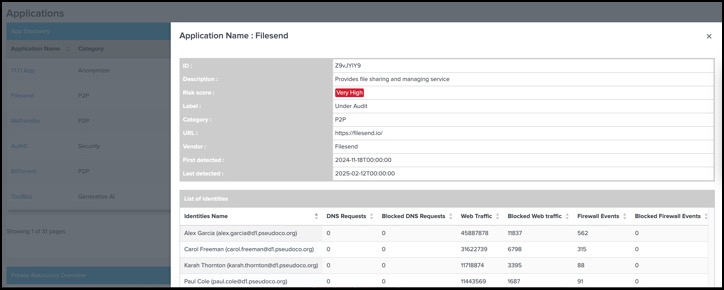
Private Resources Details
View the details about a private application and related events.
In your instance of Splunk, locate the Splunk navigation bar, click Apps, and then select Cisco Cloud Security.
Navigate to Applications > Private Resources Details.
For Search Field, choose one of the fields to use when searching for an application.
(Optional) For Search Private Resources, enter the name of an application. The application name is used to query the applications that are monitored by Secure Access.
View Access Dashboards
The app displays the RAVPN and ZTNA dashboards and the Access page only if you configure the input for the RAVPN or ZTNA event logs in the add-on.
RAVPN Dashboard
- In your instance of Splunk, locate the Splunk navigation bar, click Apps, and then select Cisco Cloud Security.
- Navigate to Access > RAVPN.
- For Search Field, choose one of the fields to use when searching for the RAVPN events.
ZTNA Dashboard
- In your instance of Splunk, locate the Splunk navigation bar, click Apps, and then select Cisco Cloud Security.
- Navigate to Access > ZTNA.
- For Search Field, choose one of the fields to use when searching for the ZTNA events.
View Cloudlock Dashboard
Navigate to Cloudlock.
Configure the time range for the data. If you do not set a time range, the app displays the data for the Last 1 Hour (last hour).
(Optional) Choose one of the predefined date ranges, or click Custom to select Custom Date Ranges.
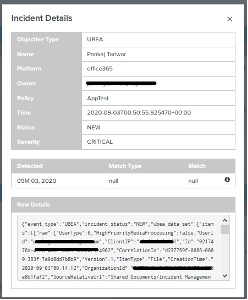
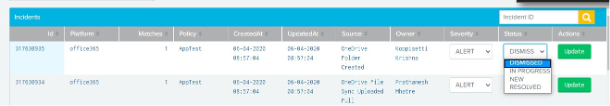
Click an ID to view the details about an incident.
(Optional) Choose the severity or status of an incident from the drop-down menu, and then click Update.
View Investigate Dashboard
Investigate
Query for the information about a domain using a domain name, URL, Autonomous System Numbers (ASN), IP, hash, or email address.
In your instance of Splunk, locate the Splunk navigation bar, click Apps, and then select Cisco Cloud Security.
Navigate to Investigate > Investigate.
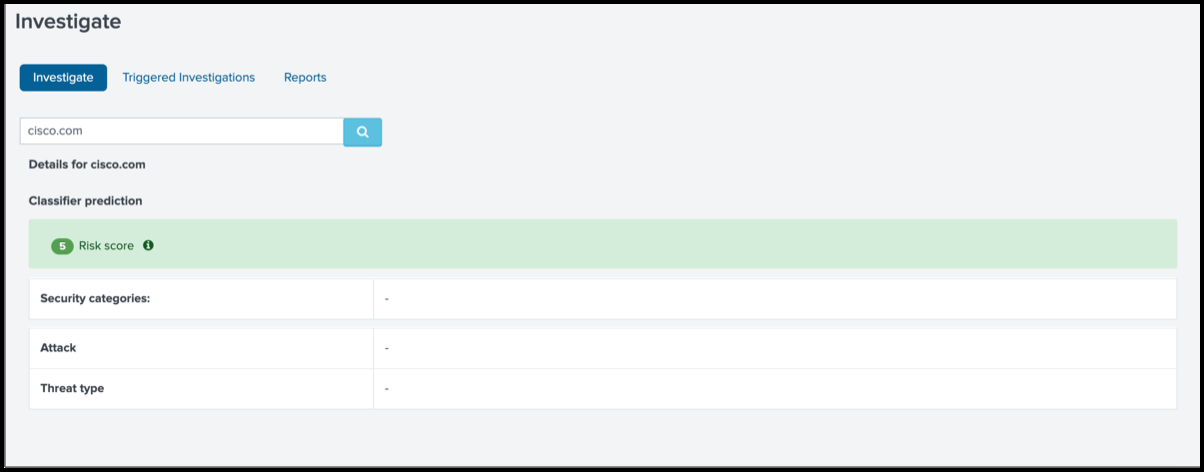
Enter a domain name, URL, ASN, IP, hash, or email address to query for detailed information about a destination.

The app displays the classifier prediction (risk score, threat type), DNS queries for the destination, WHOIS record data, associated hash samples, security features, DGA detection, IP addresses, nameservers, co-occurring destinations, and the domains related to the destination. The data is obtained through the integration of the app with Cisco Investigate.
Add a Destination to a Destination List
Use Cisco Investigate to query for information about a destination. Then, add related destinations to destination lists in the organization.
In your instance of Splunk, locate the Splunk navigation bar, click Apps, and then select Cisco Cloud Security.
Navigate to Investigate > Investigate.
Enter a domain name, URL, ASN, IP, hash, or email address to query for detailed information about a destination.
The app displays the information provided by Cisco Investigate, which includes the related domains.
Navigate to Related Domains.
Right-click on a related domain and then choose a destination list where the app adds the destination to the destination lists in the organization.
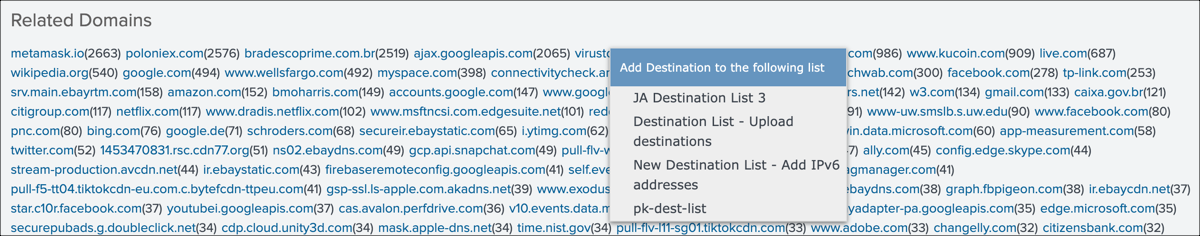
(Optional) In the dialog window, add a comment, then click OK.
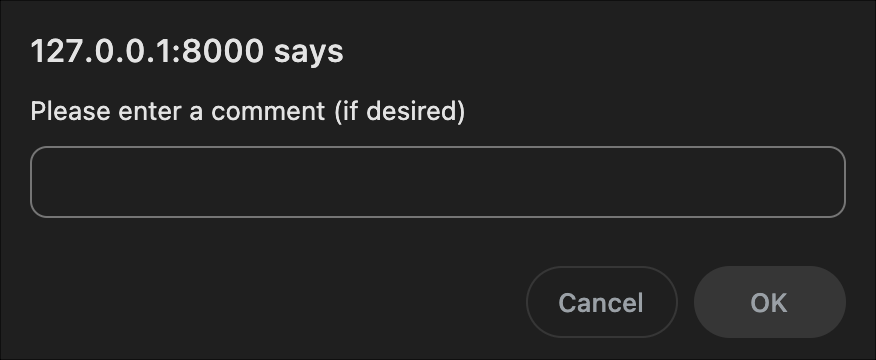
The app confirms that the destination was added to the selected destination list.
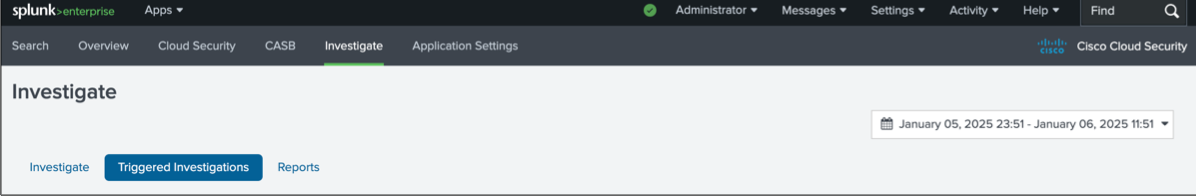
Triggered Investigations
The triggered investigation of a domain, IP, or URL can retrieve the destination name, and Investigate risk score and category.
Before you begin, configure an alert action to get the security and network information about a destination, URL, or IP. For more information, see Add To Destination List.
In your instance of Splunk, locate the Splunk navigation bar, click Apps, and then select Cisco Cloud Security.
Navigate to Investigate > Triggered Investigations.
(Optional) Choose the date and time to begin an investigation of a domain.
View the destinations lists generated by the Investigate Destinations alert action. For more information, see Investigate Destinations.
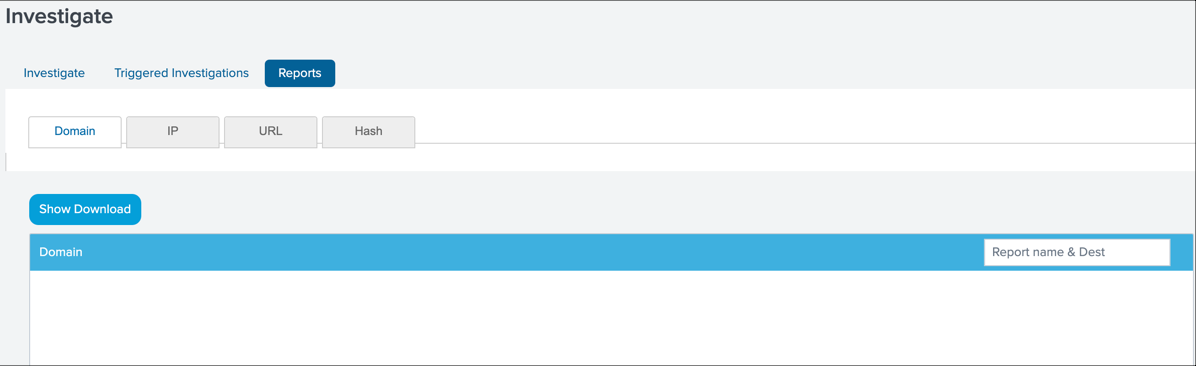
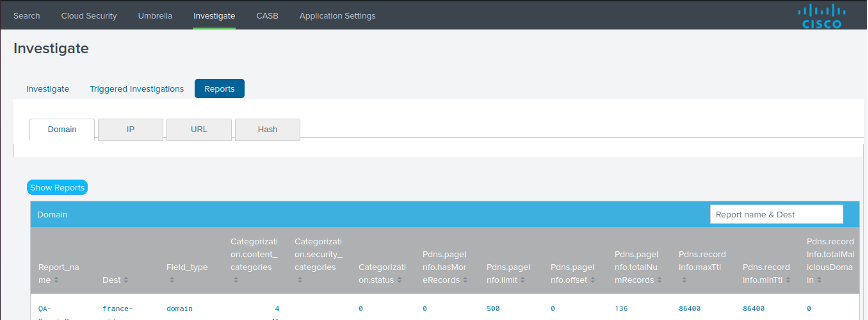
Reports
After you research a domain, IP, URL, or hash, create and download a detailed report about the destination and related information.
If the Investigate module cannot connect to the Investigate API, the app may not display data on Investigate > Investigate.
You can view the status of the Investigate module from Application Settings > Health. For more information, see View Configured Application Settings and API Health Status.
Before you begin, configure an alert action to get the security and network information about a destination, URL, or IP, or hash. For more information, see Destination Report.
In your instance of Splunk, locate the Splunk navigation bar, click Apps, and then select Cisco Cloud Security.
Navigate to Investigate > Investigate.
Enter a domain name, IP, or URL in the search to query for detailed information about a destination.
Manage Alert Actions
Set up and manage alerts on the Cloud Security App. The app has pre-configured alert actions that are available for Cloud Security.
Investigate Destinations
Add an alert for the Investigate Destinations action. The alert creates a notification in the app when Cisco Investigate receives a request for information about a specific destination. For information about the field names and types, see Field Types and Related Datasets.
In your instance of Splunk, locate the Splunk navigation bar, click Apps, and then select Cisco Cloud Security.
Navigate to Search.
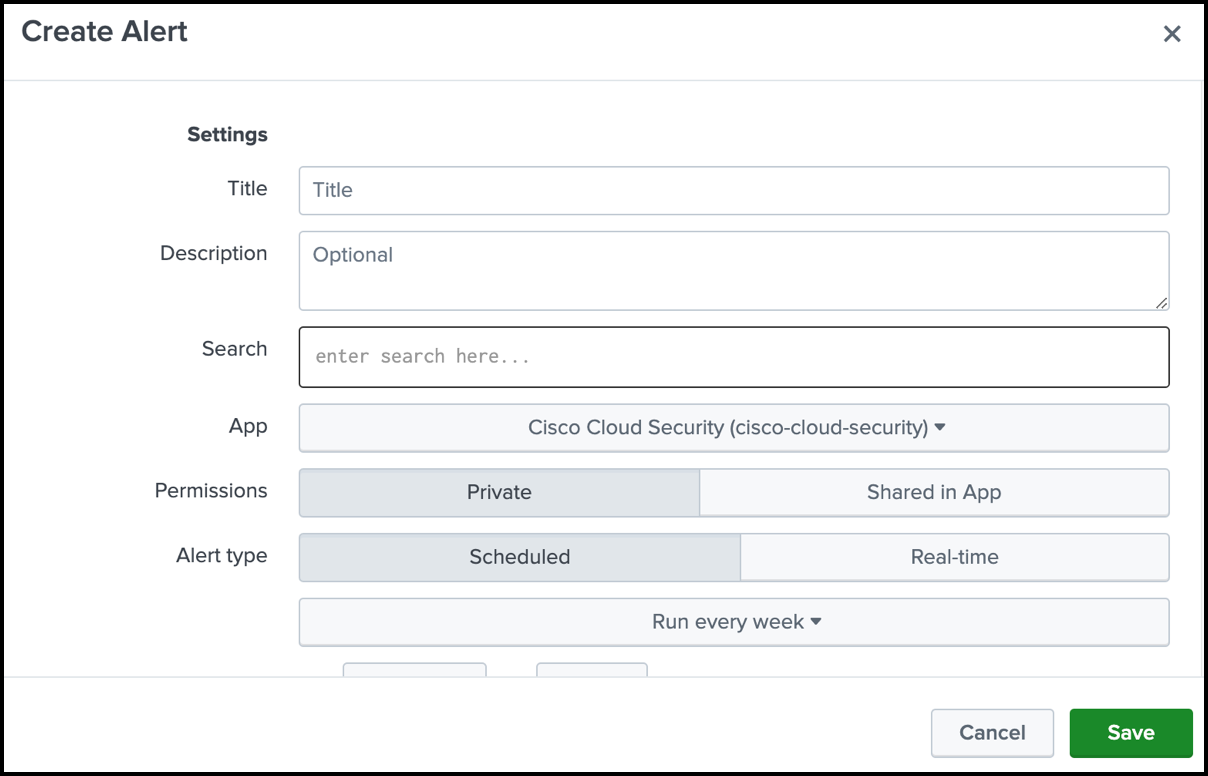
Click New Alert.
For Title, enter a label for the name of the alert.
(Optional) For Description, enter a meaningful description of the alert.
For App, choose Cisco Cloud Security (cisco-cloud-security).
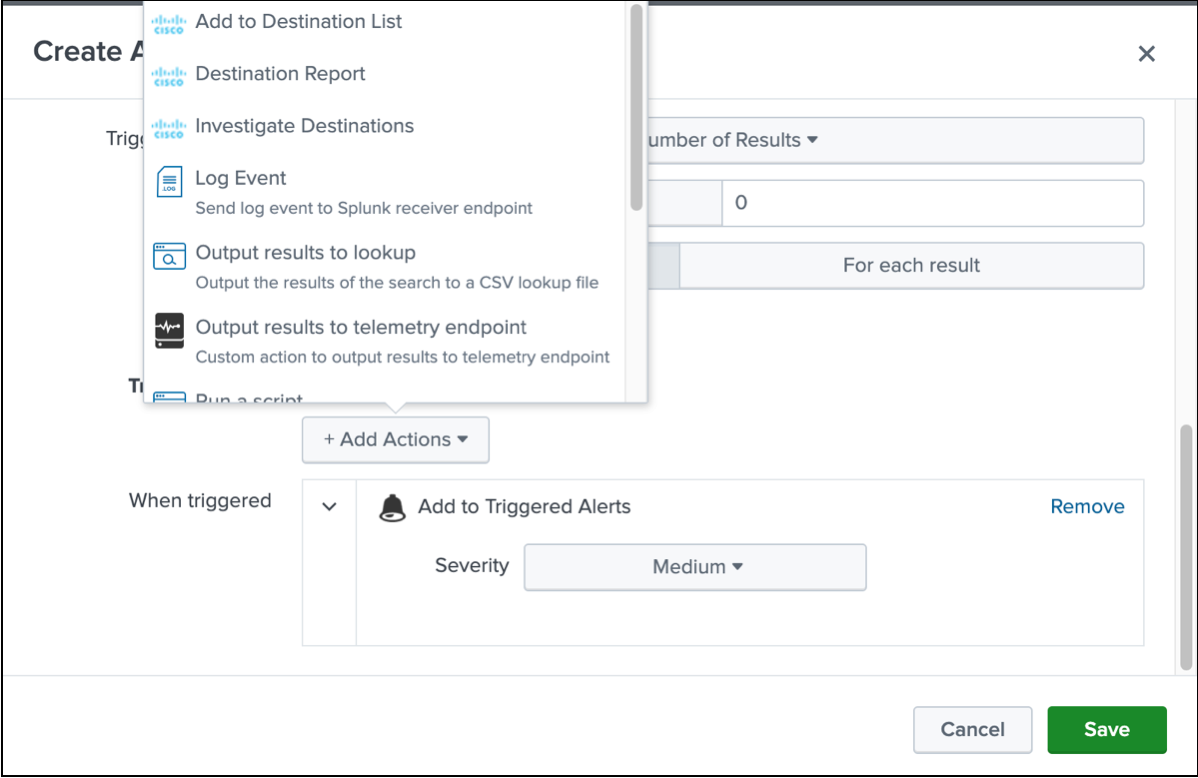
For Trigger Actions, click Add Actions, and then choose Investigate Destinations.
For Field Name, enter the name of the field in the source where you have the domain, URLs, or IP data.
For Field Type, choose the type of the field.
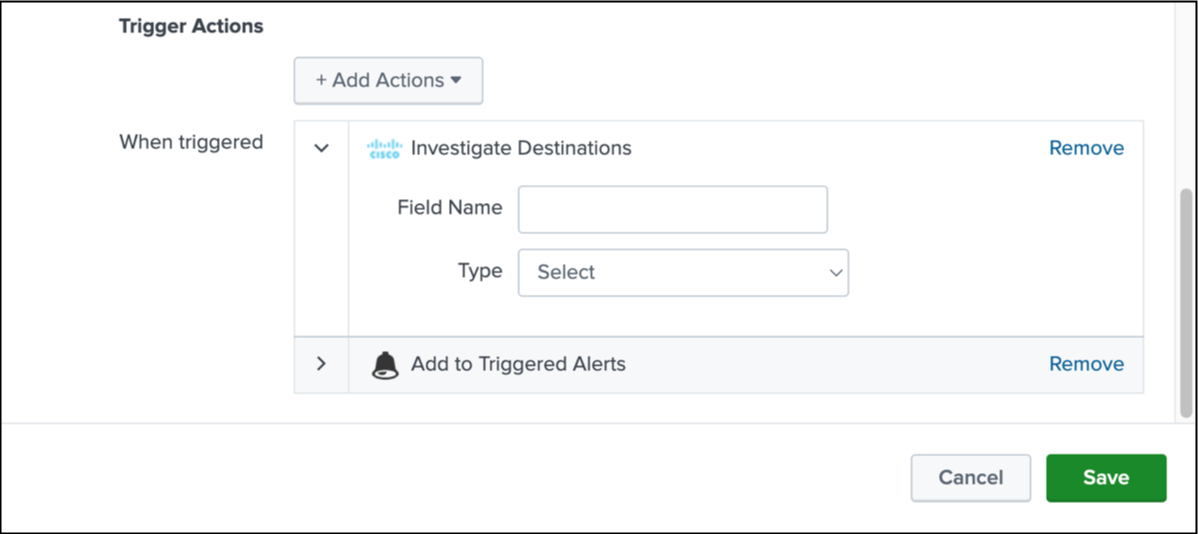
Click Save.
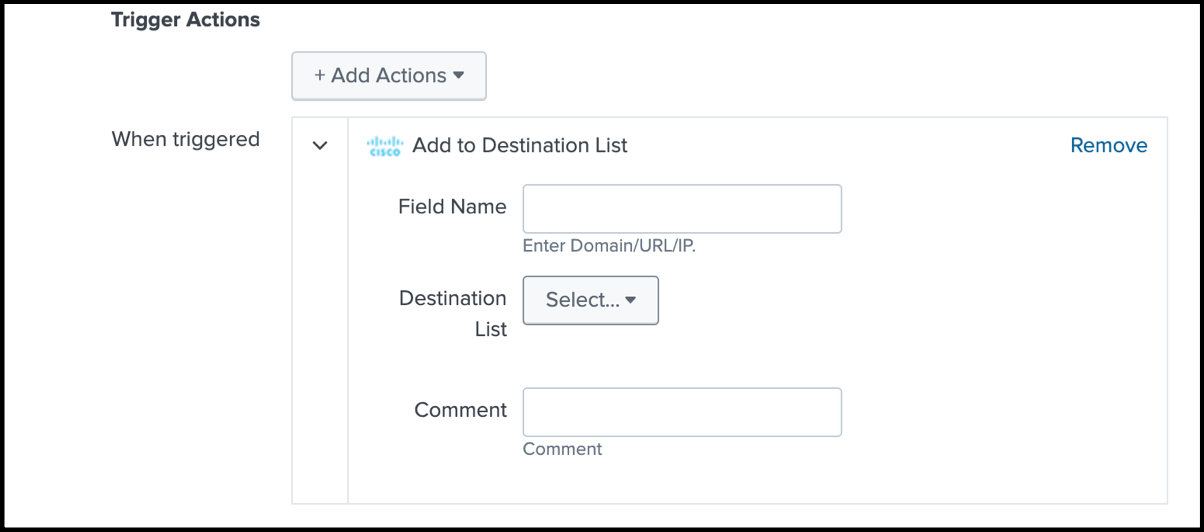
Add To Destination List
Add an alert for the Add to Destination List action. The alert creates a notification when the app receives an addition of a destination in one of the organization's destination list.
In your instance of Splunk, locate the Splunk navigation bar, click Apps, and then select Cisco Cloud Security.
Navigate to Search.
Click New Alert.
For Title, enter a label for the name of the alert.
(Optional) For Description, enter a meaningful description of the alert.
For App, choose Cisco Cloud Security (cisco-cloud-security).
For Trigger Actions, click Add Actions, and then choose Add to Destination List.
For Field Name, enter the name of the field in the source where you have the domain, URLs, or IP data.
For Destination List, choose a destination list for the organization.
(Optional) For Comment, add a comment about the destination.
Destination Report
Add an alert for the Destination Report action. The alert creates a notification of the availability of the Cisco Investigate Destination report.
In your instance of Splunk, locate the Splunk navigation bar, click Apps, and then select Cisco Cloud Security.
Navigate to Search.
Click New Alert.
For Title, enter a label for the name of the alert.
(Optional) For Description, enter a meaningful description of the alert.
For App, choose Cisco Cloud Security (cisco-cloud-security).
For Alert type, choose Scheduled or Real-time.
For Trigger Actions, click Add Actions, and then choose Destination Report.
- For Report Name, enter a meaningful name for the report.
- For Field Name, enter the name of the field in the source where you have the domain, URLs, IP, or hash data.
- For Field Type, choose the type of the field (
Domain,URL,IP, orHASH). For information about the field names and types, see Field Types and Related Datasets. - For Investigate datasets, select the type of data from Investigate to include in the report.
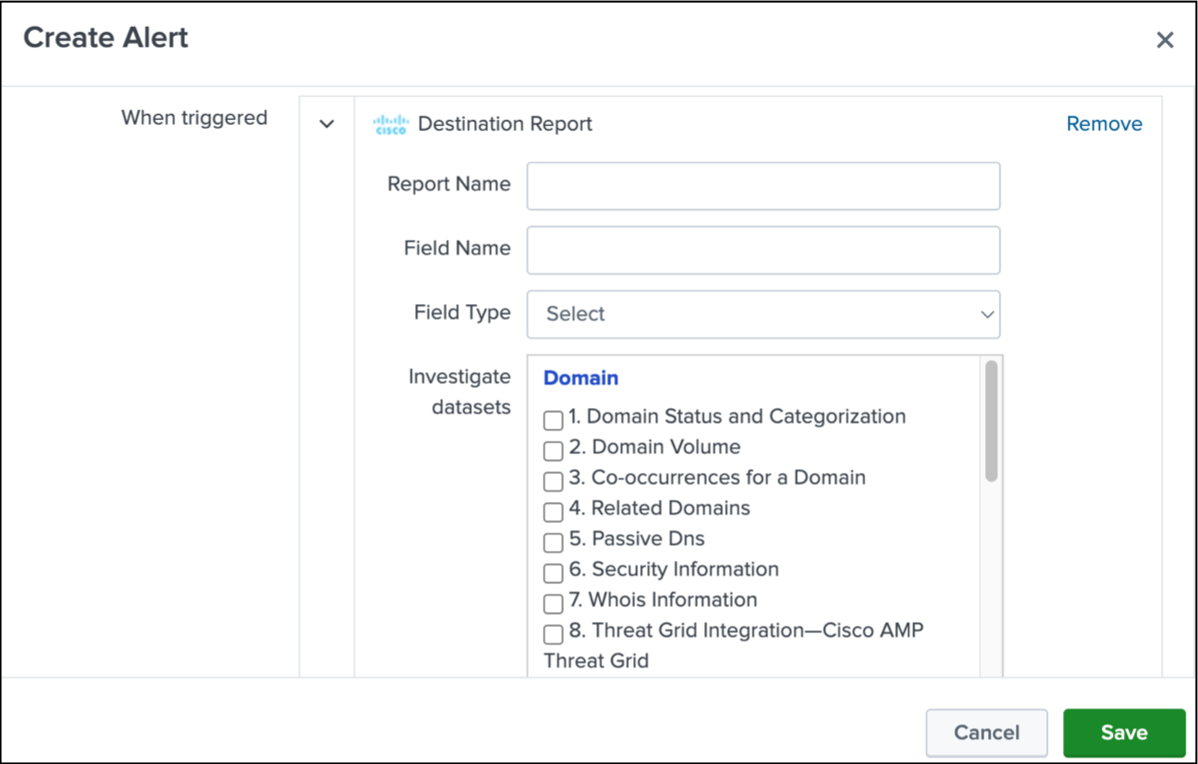
Click Save.
Field Types and Related Datasets
Use the name of the fields and type of data to create the alert. Select the datasets that are associated with the selected field type.
| Field type | Dataset |
|---|---|
| Domain |
|
| IP |
|
| URL |
|
| Hash |
|
Contact Support
- If you have questions about configuring Umbrella in the Cisco Cloud Security App for Splunk, contact Cisco Umbrella Support.
- If you have questions about configuring Secure Access in the Cisco Cloud Security App for Splunk, contact Cisco Support.