Use Case
Secure Network Analytics Response Management Host Alarm Rule and Actions allow you to export information about both active and inactive host alarms. In previous versions, multi-peer host alarm exports used the placeholder IP address 0.0.0.0 and included empty context for multiple sources or targets, resulting in misleading or unusable data for downstream automation.
Starting with the 7.5.3 release, exported host alarm data includes two new flags: source_multiple_ip and target_multiple_ip. When either flag is true, downstream consumers can detect a multi-peer alarm and use the Associated Flows API to retrieve the flows associated with the alarm, then extract source or target peers from that data.
This use case describes how to use the Associated Flows API to retrieve the flows related to exported multi-peer host alarms, providing peer context.
1. Check your Response Management Configuration
To begin navigating the API, make sure your Response Management is configured with Host Alarm Rule and Action to export alarm information.
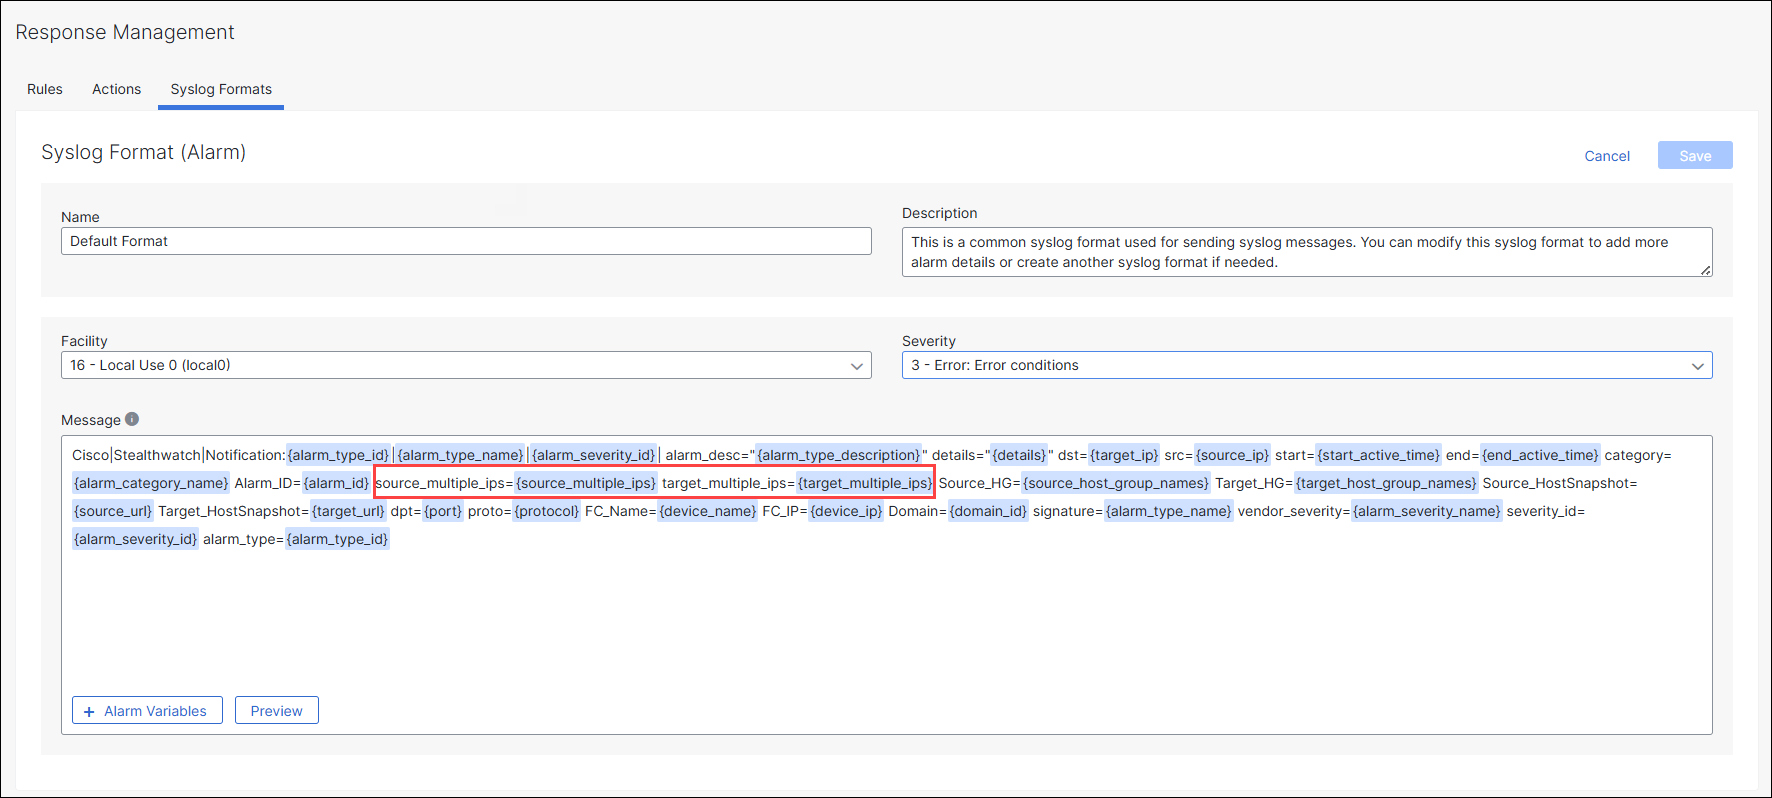
For Syslog action, by default, on a newly deployed v7.5.3 system, the Default Format already includes source_multiple_ip and target_multiple_ip flags.
If you have upgraded from a previous version, you will need to manually update your Syslog Formats to include these new parameters:
Login to your Manager as administrator.
From the main menu, choose Configure > Response Management > Syslog Format.
Choose Default Format for Alarms type.
In the Actions columt, click Edit.
In the Message field, click Add Variable.
From the menu, choose
source_multiple_ipandtarget_multiple_ipalarm parameters.Note: Make sure to include these parameters before the
source_host_group_namesandtarget_host_group_namesfields as the host group lists can be rather long and stands the chance of truncating these fields out of the syslog message.Click Save.
2. Get the Alarm ID
Once new Alarms are generated, you should see these new parameters present in the alarm data, indicating that the alarm in question does or does not include multiple source and/or target IPs.
Collect the Alarm_ID value.

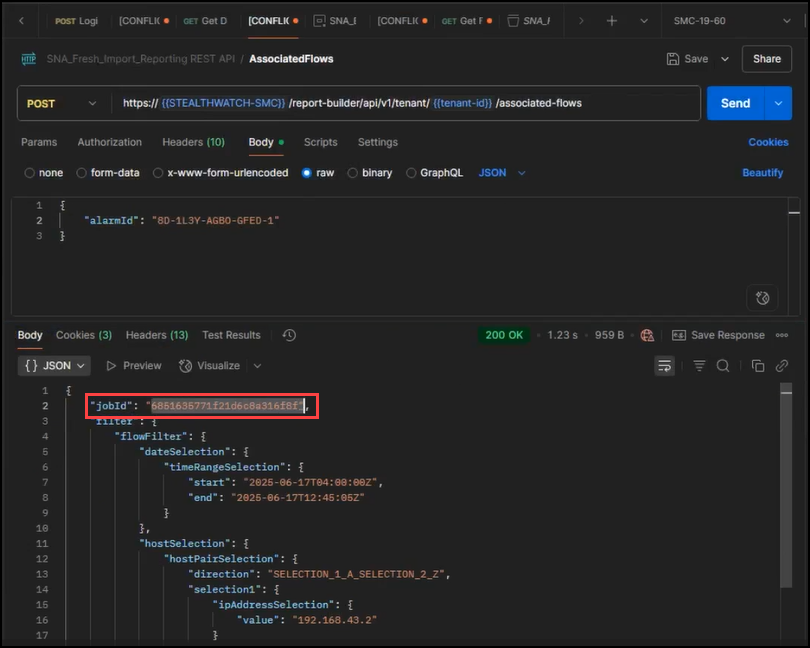
3. Invoke an Associated Flows API
Use the Alarm_ID value you have collected previously and issue a POST request to the new Associated Flows API endpoint.
Note: In the Report Builder API v1
/report-builder/api/v1, the URL path is going to be different from the Reporting API v2sw-reporting/v2endpoints. The API call takes a mandatoryalarmIdparameter and an optionalmaxRecordsparameter.
Request
curl -L --request POST \
--url https://{serviceaddress}/report-builder/api/v1/tenant/{tenantId}/associated-flows \
--header 'Content-Type: application/json' \
--header 'Accept: application/json' \
--data '{
    "alarmId": "8D-1KTA-L27J-A3O0-1",
    "maxRecords": 2000
}'
Response
The body of the response should include a jobId which can then be used to track the status of the query and to later return the results.
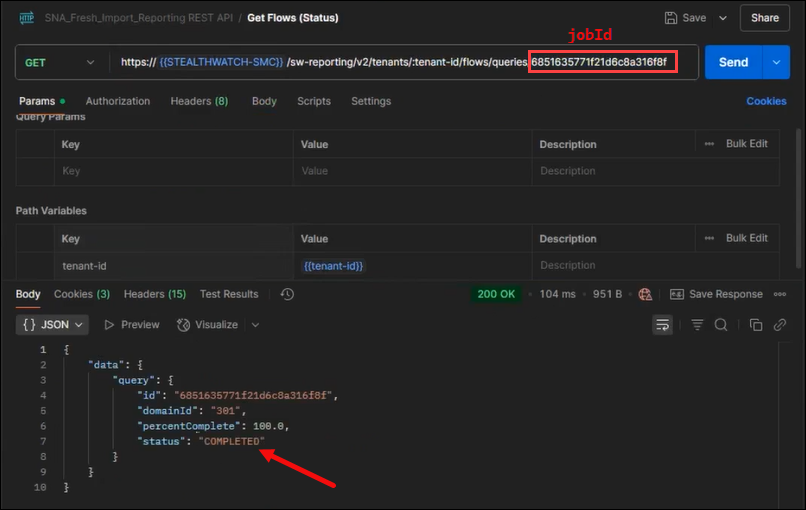
4. Check Status of the Flow Query
Using the flow search jobId you received previously, query the /sw-reporting/v2/tenants/<tenant-id>/flows/queries/<job_id> endpoint to return the status of the flow search.
In an automated environment, this query would be put into an iterative loop, checking repeatedly the status and looking for a status of COMPLETED.
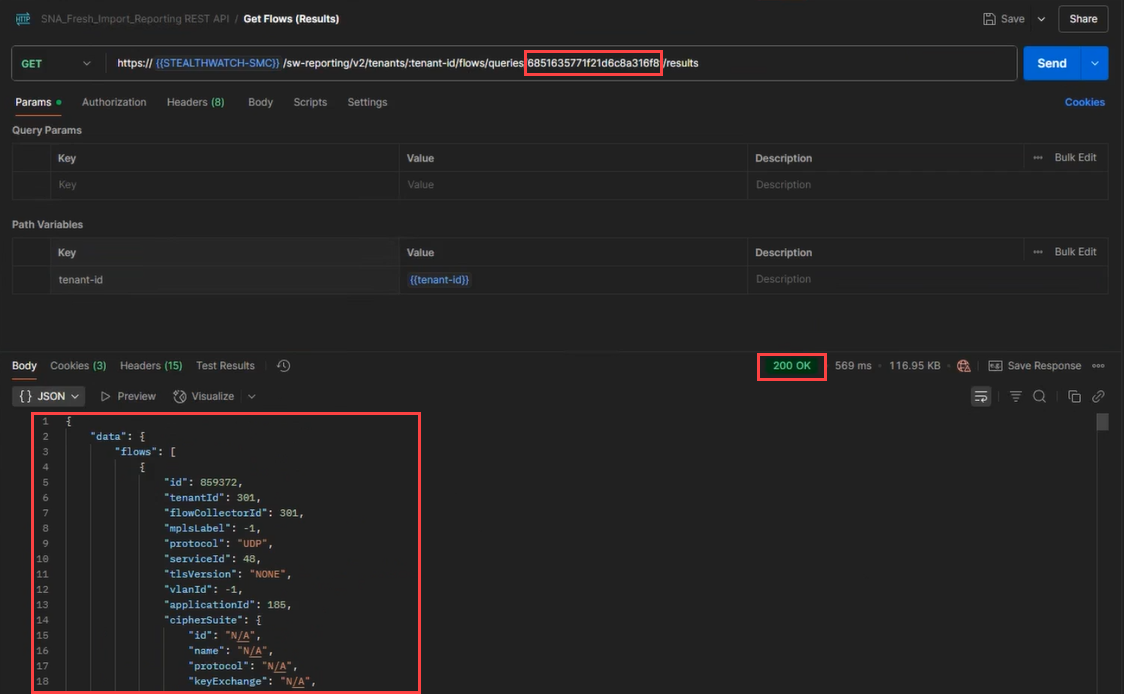
4. Retrieve the Flow Search Results
Now that the query job has COMPLETED, issue a GET to the query results API endpoint to retrieve the results.
Note: The Associated Flow API call will only work for Alarms that are based on individual Security Events. Alarms for Alarm Category events, are not compatible with the associated flows API endpoint and will respond with a
400 - Bad Requestand an error code ofalarmNotSupported. This is normal and is in line with the experience of pulling associated flows from within the Web UI.