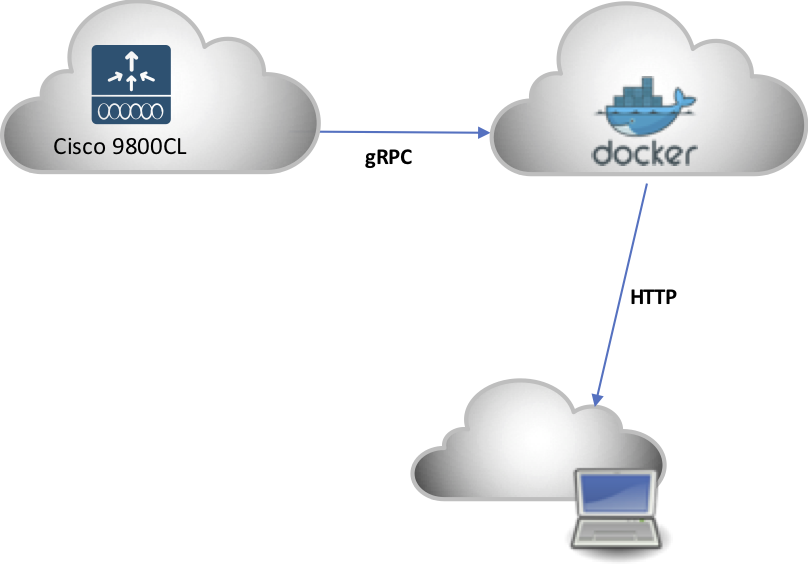
This is a setup to perform real time visualisation and analysis of C9800 wireless controller telemetry data streaming. It uses dial-out telemetry to push a periodic stream of wireless operational data to an open source collector: pipeline

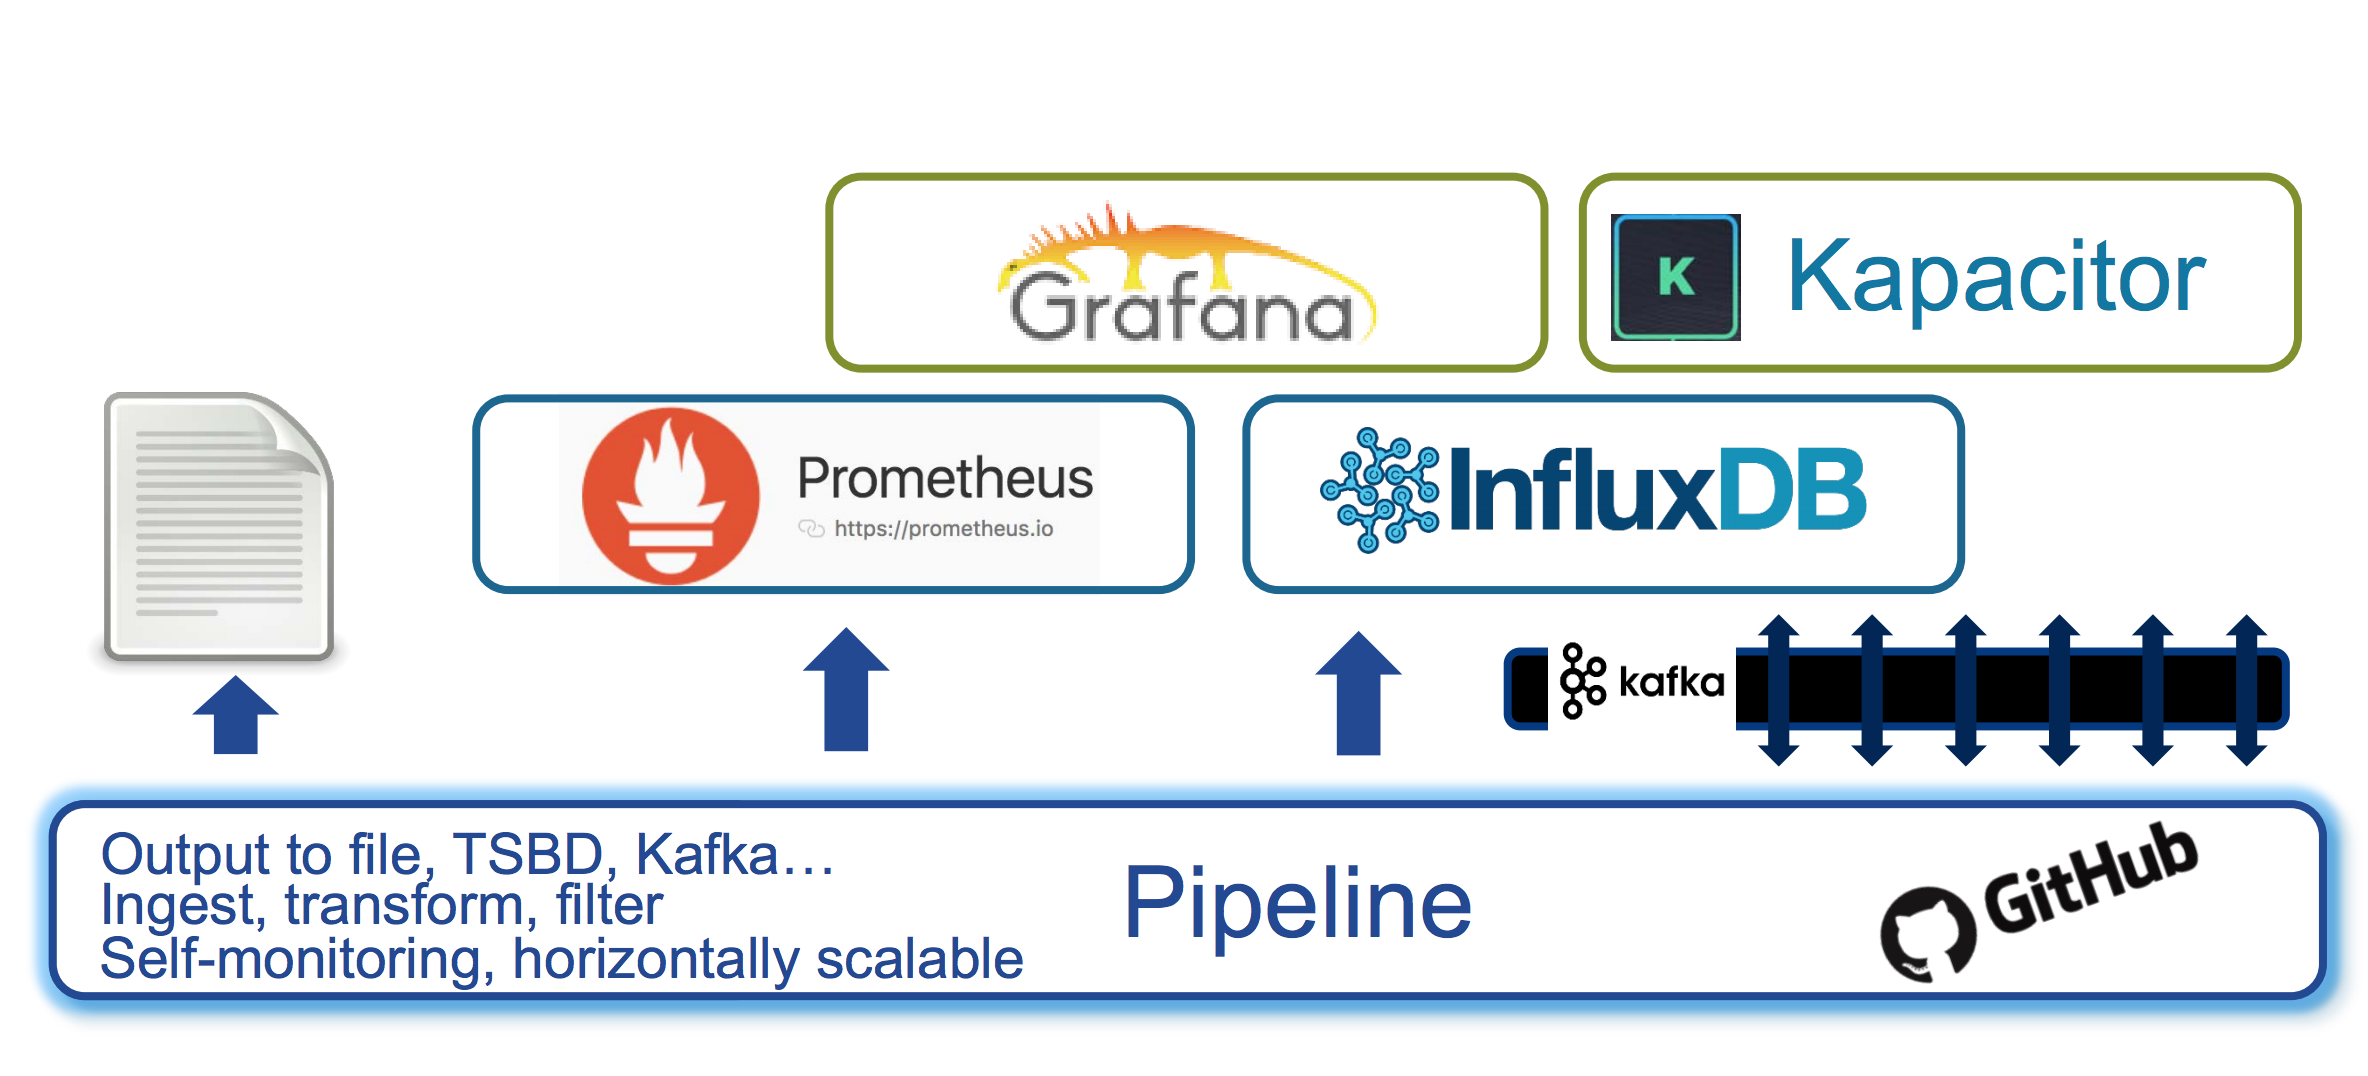
A number of different flows are possible, since pipeline is capable to export to a great variety of sources. On this particular demo, InfluxDB + Grafana are used to display live data

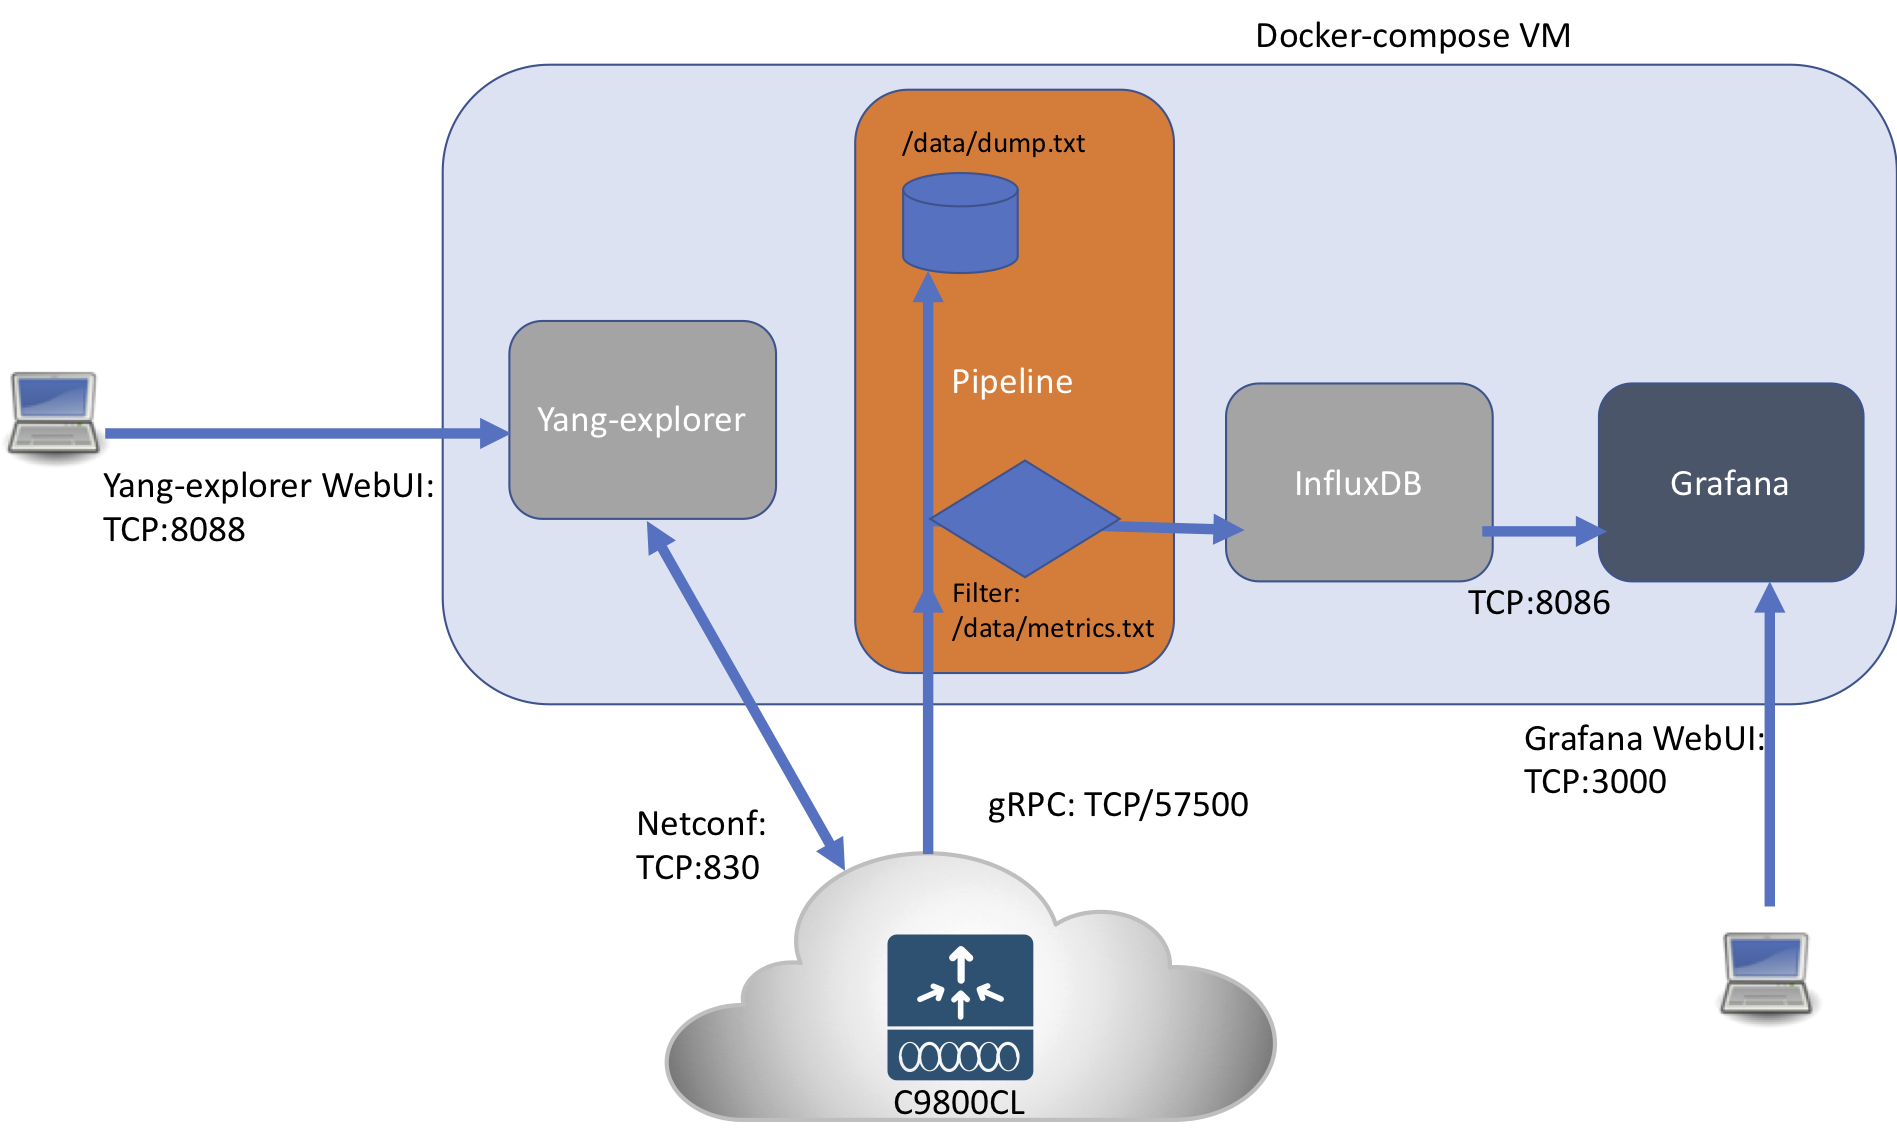
Structure of docker composition
The setup is packaged in 4 different Docker containers, which are brought together using docker-compose.

Telemetry data from Cisco C9800 wireless controller is sent to pipeline
Pipeline is configured to accept telemetry data using grpc and output two streams:
Raw 'tap' data, for debugging purposes Influxdb data output, filtered using the pipeline filter described on this guide.
Another container runs Grafana which consumes Influxdb data to produce the real time visualization.
Also, a container for yang-explorer is present, so we can interactively browse the YANG model of the device. In order to use the yang-explorer UI, we need to point our browser to the IP address of the docker-compose VM, port 8088, with a flash-enabled browser.