RF analysis Tools
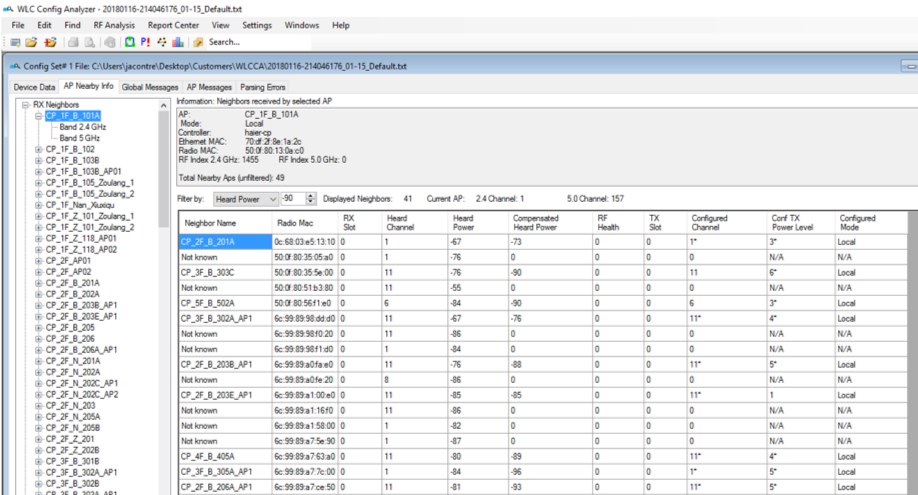
Nearby Data
Tree view per AP, showing the RX and TX neighbors
Based on NDP Exchange between APs
Used by RRM to make channel and power allocation decisions
Think of it as the “RF distance” vs the physical placement of the AP
RX data is displayed based on the config file information. TX data is calculated
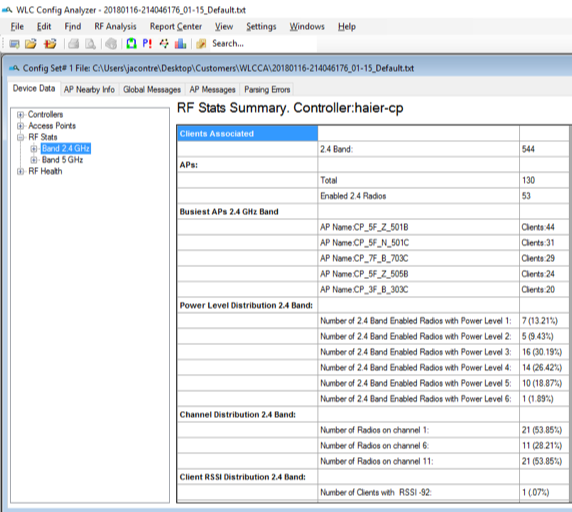
RF Stats Summary
Look for non-average channel distributions
Look for power levels (all high, too many low)
Client SNR (too far, too close)
Quick check for change monitoring (example: TPC threshold change effects)
AP role distribution
Summary per controller, and per all files loaded
RF Stats per AP group and Flex group
Data summarization done at AP/Flex group level, to provide insights on how RF is performing per location/deployment
Identify co-location problems
See total neighbors per AP, detect the most visible ones
Find the highest channel utilization points, or associated clients with just one click
Find AP quickly with large number of low SNR clients