Meraki Alerts with PagerDuty
“PagerDuty Integrates Machine Data + Human Intelligence To Accelerate Response.”

Overview
This guide demonstrates how you can easily capture Meraki Dashboard alerts into PagerDuty. From there, you can dynamically generate incidents and IT workflows.
More Info
Setup
The integration is pretty simple. You will just need to add a new integration into PagerDuty using a Transformer tool to capture the Meraki alert data. A small bit of JavaScript is used to parse the message before it is consumed by the service.
PagerDuty
To begin, login to PagerDuty or create an account.
Create a New Service
Configurations → Services
Name the service, such as “Meraki Alerts with Webhooks”
Then, select the Integration Type as “Custom Event Transformer”

Complete the remaining incident settings as desired and the save by pressing the Add Service button at the bottom.
A new transformer is now available.
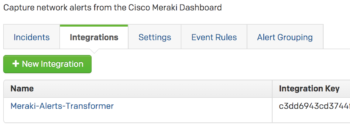
Click on the name of your new transformer to view the details.
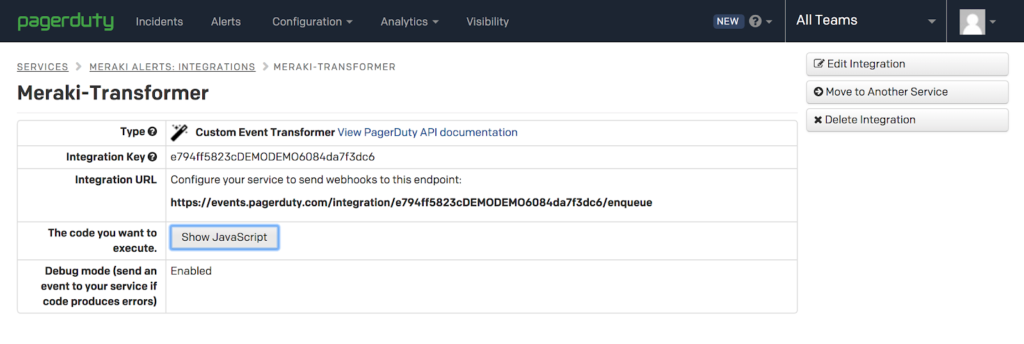
Your Integration URL will be used as the webhook address for the Meraki Alerts so note this for a future step.
https://events.pagerduty.com/integration/e794ff5823cDEMODEMO6084da7f3dc6/enqueue
Update the JavaScript code
Press the “Edit Integration” button
Replace the code in the editor with the following code and save your changes.
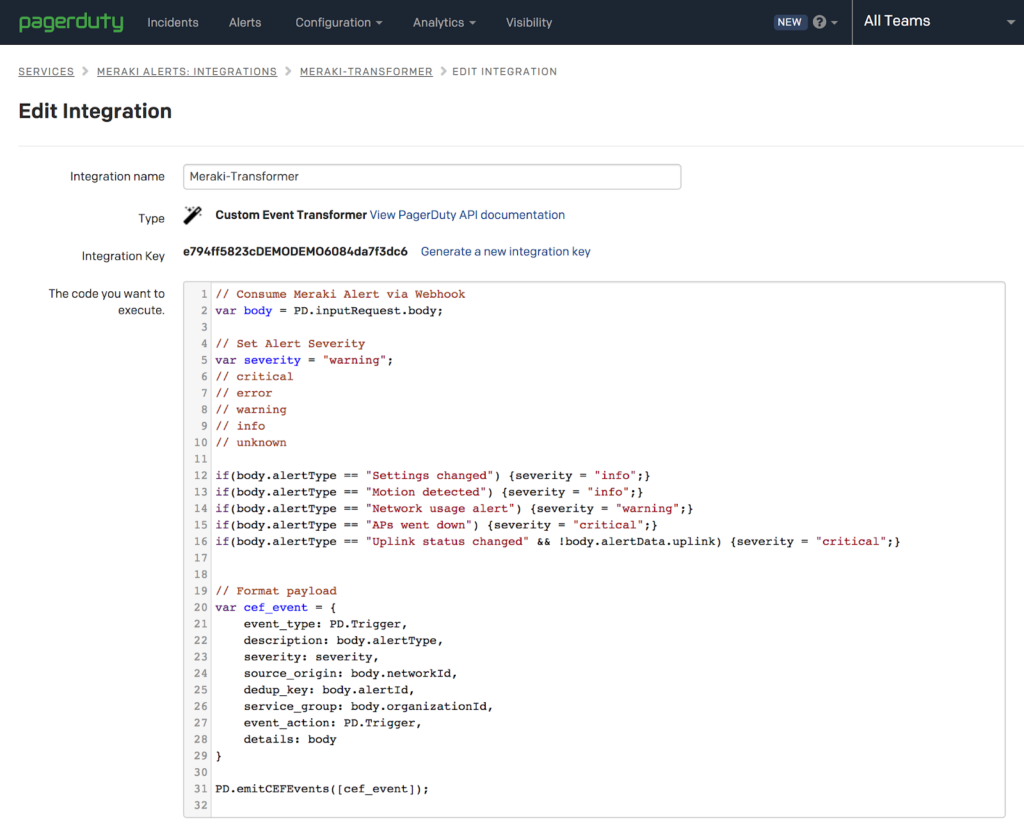
// Consume Meraki Alert via Webhook
var body = PD.inputRequest.body;

// Set Alert Severity
var severity = "warning";
// critical
// error
// warning
// info
// unknown

if(body.alertType == "Settings changed") {severity = "info";}
if(body.alertType == "Motion detected") {severity = "info";}
if(body.alertType == "Network usage alert") {severity = "warning";}
if(body.alertType == "APs went down") {severity = "critical";}
if(body.alertType == "Uplink status changed" && !body.alertData.uplink) {severity = "critical";}


// Format payload
var cef_event = {
	event_type: PD.Trigger,
  	description: body.alertType,
	severity: severity,
	source_origin: body.networkId,
	dedup_key: body.alertId,
	service_group: body.organizationId,
  	event_action: PD.Trigger,
  	details: body
}

PD.emitCEFEvents([cef_event]);
The above code captures the alert data via a JSON post. The data is then parsed and a severity type is assigned to a specific alertType. These can be adjusted or removed entirely if desired.
You could also add logic here to filter out the messages based on the body.sharedSecret to match a user defined password. Just replace the last line of code with this.
// Check secret and store event
const SECRET = "asdf1234";

if(body.sharedSecret == SECRET){
   PD.emitCEFEvents([cef_event]);
}
Configure Meraki Alerts
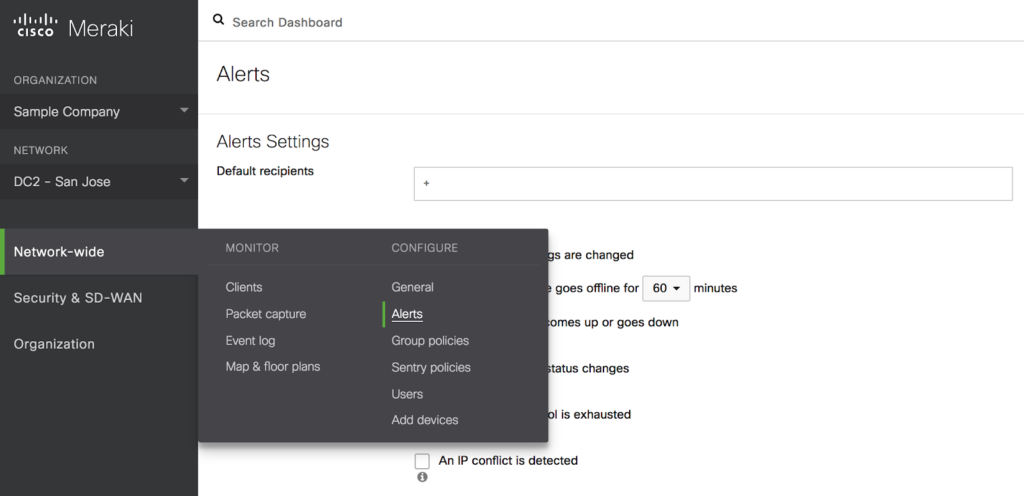
Login to the the Meraki Dashboard.
Select the Organization and Network you wish to work with and select the Alerts menu.
Network-wide → Alerts
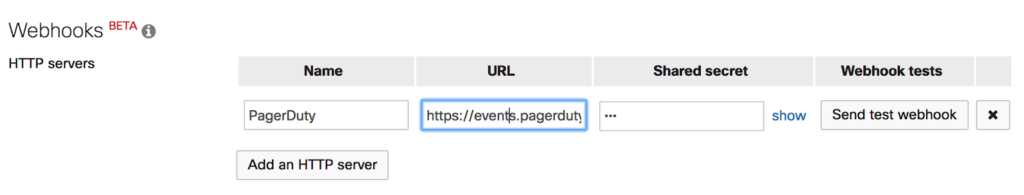
Add a New HTTP Server
Use the Integration URL provided by PagerDuty as the webhook URL.
Test
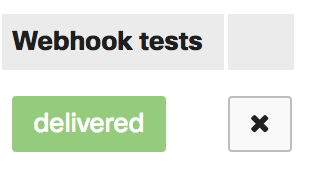
Press the “Send test webhook” button to generate a message. If all goes well, it will say “delivered.”
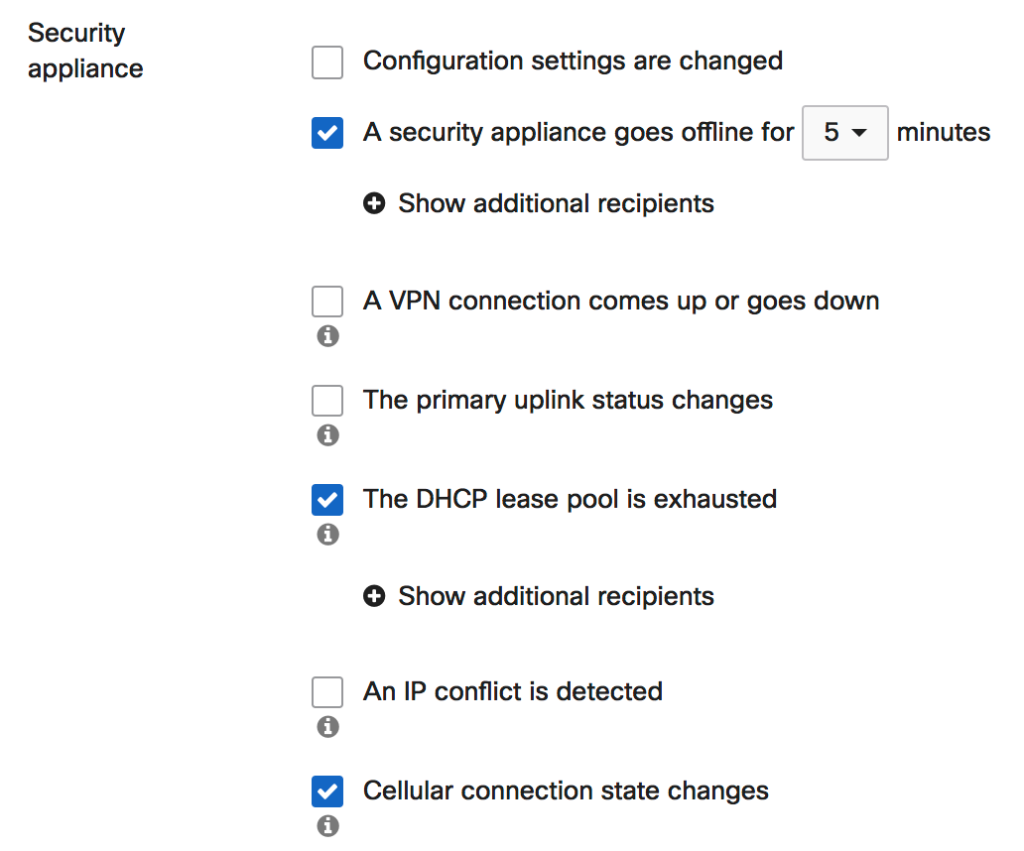
Add any additional alerts that you want to capture.
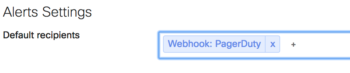
Add the new Webhook as a default recipient and save your changes.
Verify
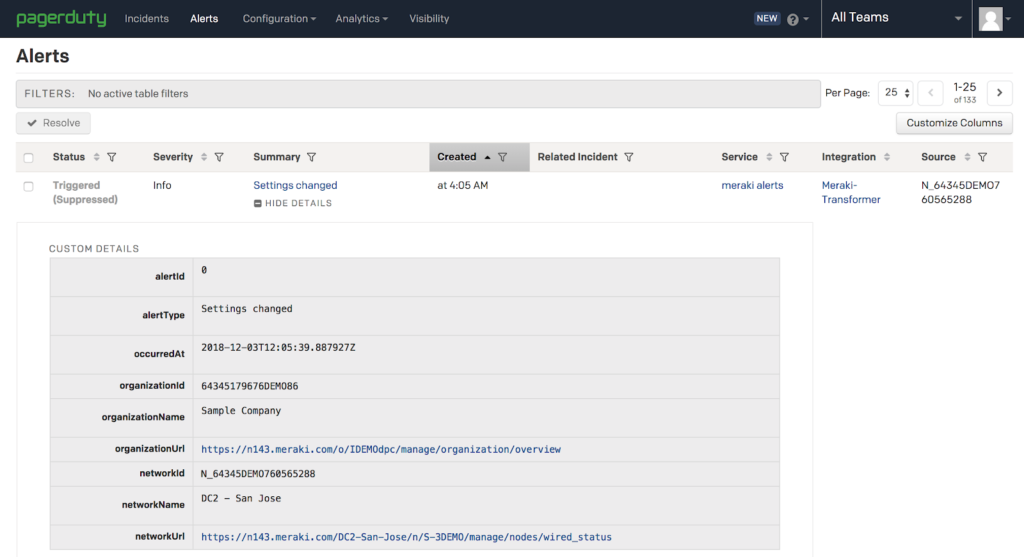
You should see a new Alert in PagerDuty that was generated by our test event.
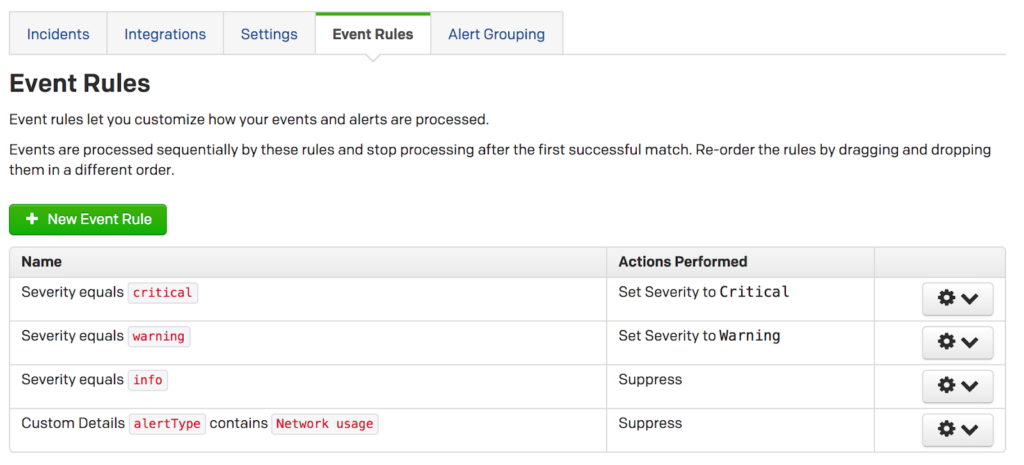
The PagerDuty system can also be further configured based on your own escalation and assignment requirements. Create an Event Rule to better categorize the incoming alerts.
Success!
You have now extended the power of the Meraki cloud with PagerDuty.
Share your stories and examples with our API community!