A Developer's Guide to OpenTelemetry and AppDynamics
OpenTelemetry provides standardized instrumentation for observability and application troubleshooting. Discover the history, components, and best practices for maximizing OpenTelemetry and AppDynamics.
Estimated time to read: 9 minutes
OpenTelemetry, or OTEL, grants developers the ability to use standardized instrumentation for observability and application troubleshooting. This article will explore the history and components that make up OTEL, as well as the value it brings to developers. We’ll dive into the relationship between Cisco AppDynamics and OTEL, and provide best-practices for how developers can maximize both to gain greater visibility into their distributed systems. (For an in-depth article specific to OTEL, take a look at our ‘What is OpenTelemetry?’ article.)
OpenTelemetry definition and history
The name OpenTelemetry is derived from open source (Open) and the word Telemetry, which is defined as the in situ collection of measurements or other data at remote points and their automatic transmission to receiving equipment (telecommunication) for monitoring. Telemetry itself is derived from the Greek roots of tele, “remote”, and metron, “measure.”
Predecessors
The concept of generating, gathering, transmitting, and analyzing telemetry in software is not necessarily new. In the past, there were several vendor-specific solutions on the market which came with vendor lock-in and, as a result, lack of compatibility when migrating platforms. There were also two groups, OpenTracing and OpenCensus, which created open source telemetry approaches.
In May of 2019, these groups merged to form OpenTelemetry. OpenTelemetry is now a CNCF (Cloud Native Computing Foundation) sanbox project, has a frictionless migration experience, and is thought of as the primary version of OpenTracing and OpenCensus.
OpenTelemetry governance and contributions
OpenTelemetry provides a standard way of describing and generating data about the state of a single or distributed system regardless of the programming language. Instrumentation is available for seven supported languages with four more under development. The supported languages are provided with a collection of tools and SDK’s used to instrument, generate, collect, and export application telemetry.
Developers can contribute to the project and keep up with the latest developments on the OpenTelemetry GitHub site.
Two considerations while instrumenting applications
There are two considerations when instrumenting applications with OTEL. First, how do we generate data? Second, what do we do with this data?
We can answer the first question by using OpenTelemetry SDK’s in the language of choice. Whenever we use OpenTelemetry, we are offered the choice of automatic or manual instrumentation. Automatic instrumentation, as the name suggests, automatically collects data such as duration of HTTP responses and HTTP response codes at the edges of a service or application. Due to its simplicity, automatic instrumentation is a great way to get started with instrumenting code and distributed tracing. If data is needed beyond what is provided with automatic instrumentation, manual instrumentation is also a valuable option. Although it’s more work, it provides substantially more customization of the data needed.
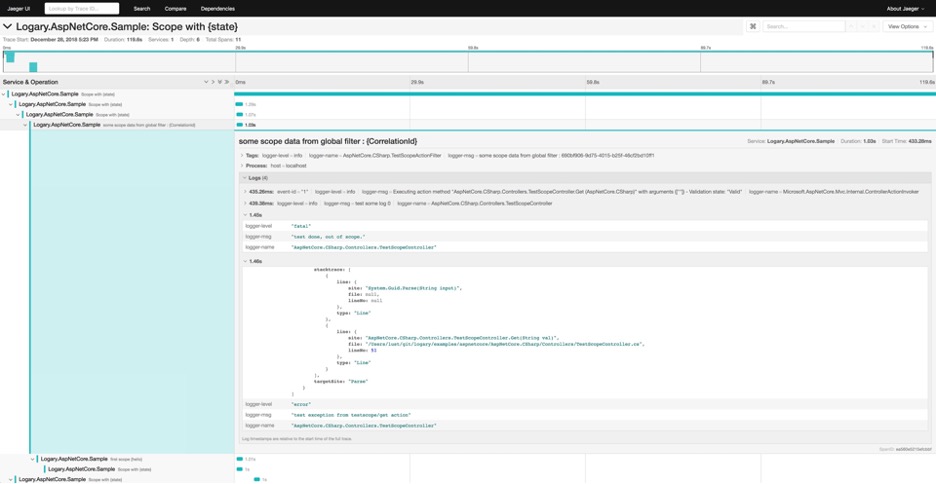
Once the data is generated, it can be visualized with open source distributed tracing platforms such as Jaeger. A developer uses tools such as Jaeger to troubleshoot, perform root cause analysis, find performance or latency issues, and find dependencies among micro-services. Trace data along with other forms of observability data are then exported for central processing, analysis, and visualization with tools like Cisco AppDynamics.
Categorizing data with MELT

Instrumented applications generate different types of data based on what information is needed. Instrumented code generates data categorized as metrics, events, logging and tracing (MELT). Generating and storing data is potentially expensive at scale so each type of data serves the purpose of providing specific information about components or, collectively, the system as a whole. Together, MELT data can be studied using OpenTelemetry and AppDynamics to understand the health and performance of applications.
To demonstrate the use of MELT, we provide a simple example of a fictitious tow truck application to server as a backdrop and context for explaining the concepts.
Metrics
A metric is a numeric measurement of something that occurs at a moment in time. These measurements have a type of aggregation measurement that categorizes and visualizes data with counters, gauges, and histograms. It typically has a name, one or more numeric values, and a timestamp.
Aggregate representations of the data provide for diverse metrics such as sum-of-squares, maximum, minimum, average, and totals. It is also worth mentioning that aggregation has the distinct advantage of consuming less storage space because it is possible to provide a summary of a result based on multiple data points over a period of time. For example, a metric could provide revenue for tows completed over the last hour. Instead of collecting and storing five distinct data points, an average collected over five data points is reported and stored as shown in the table below.

Events
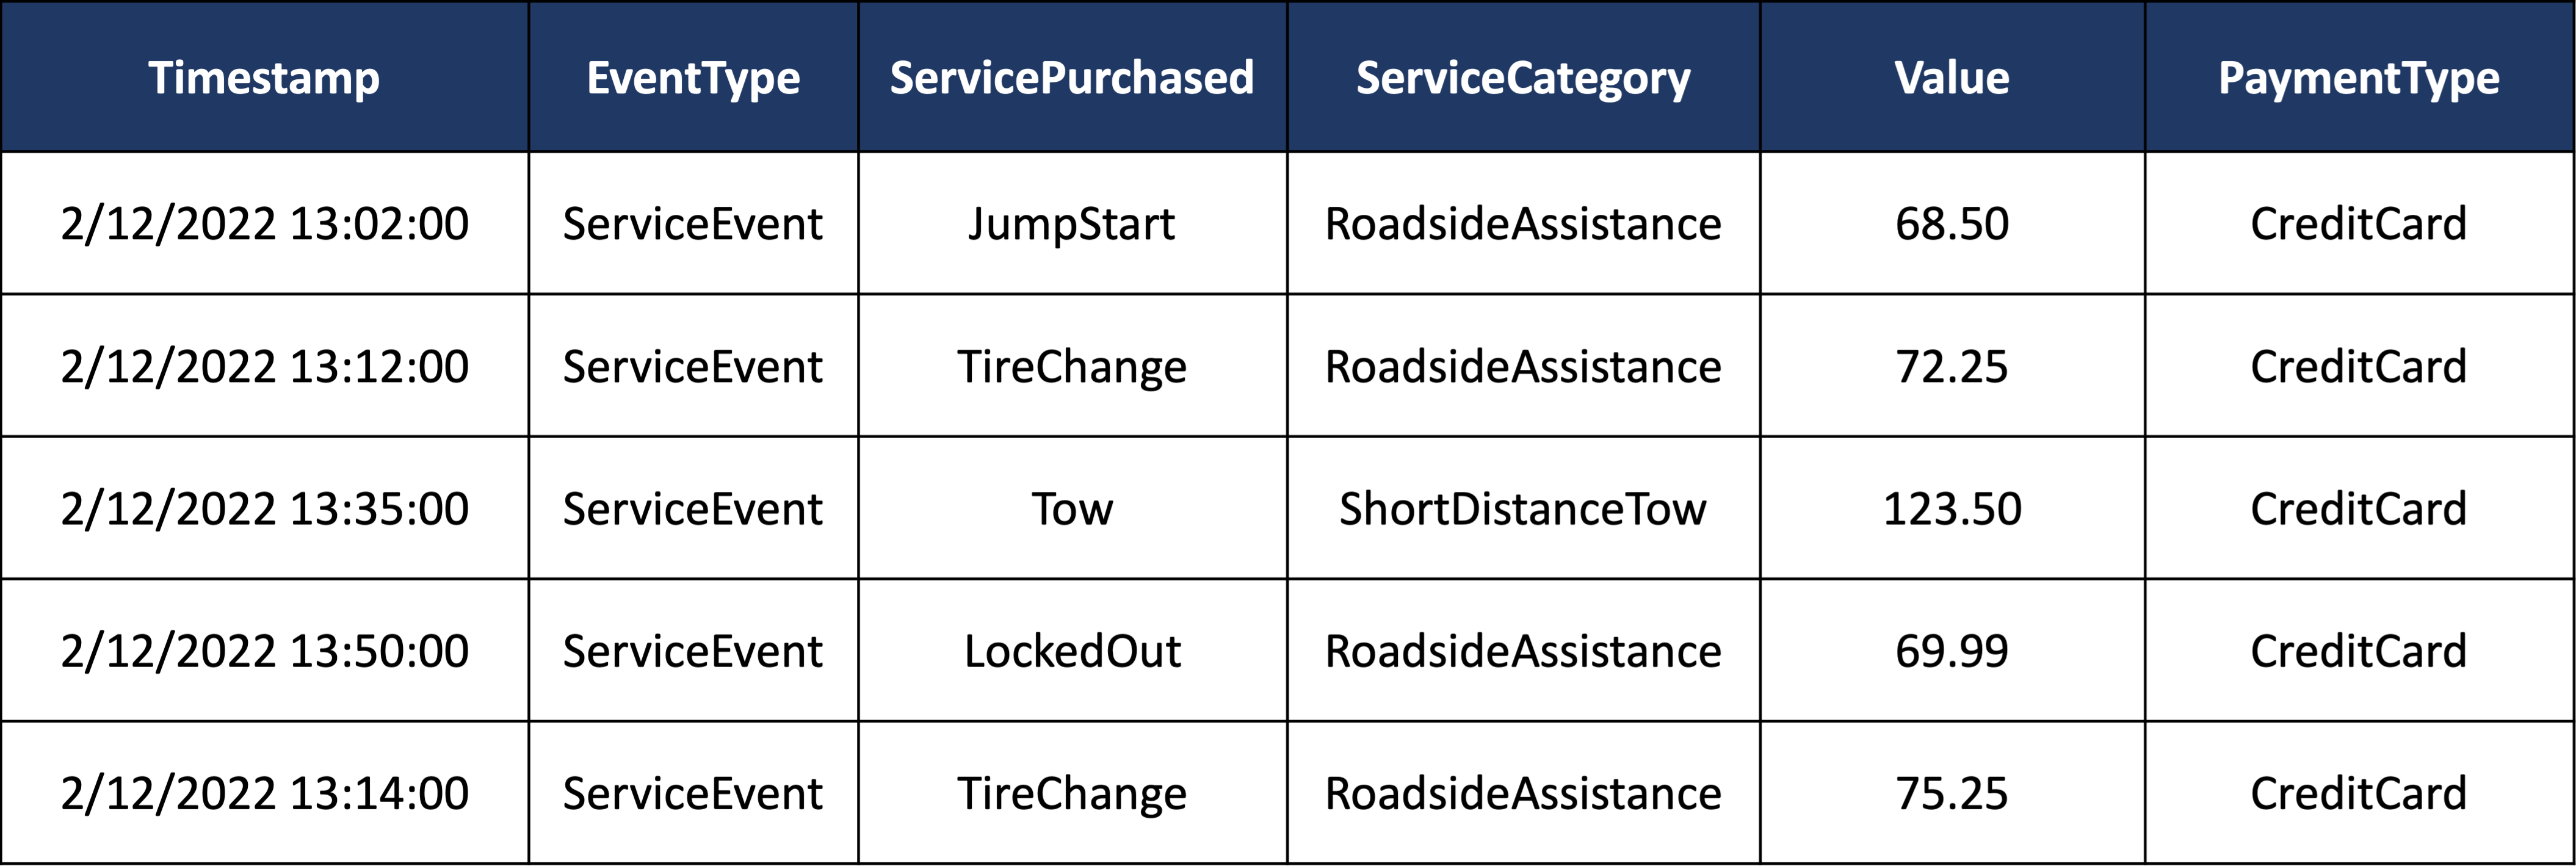
Events are conceptually discrete occurrences or actions at a moment in time. For instance, tow truck requests for service events would look like the values in the table below.

Event data can be used to answer questions such as “how much revenue did we generate over the past hour?” Running an operation that sums up the Value column shows we earned $412.49.
Events typically have a timestamp, one or more descriptors of what occurred, and a value to quantify the action that took place. Metadata was added to the above events to make them more valuable. With the additional metadata, we now have what we need to answer questions like, “How much money was made in each category? Do we earn more money with Roadside Assistance than with Short Distance Tows? How much money do we make per day?”
Logs
Logs are a familiar data type to many professionals as they historically were, and still are, available on everything from network devices to applications to servers. Logs provide unstructured data about past occurrences. The below example shows an over-simplified, unstructured log output at a backend server processing tow truck requests.

The unstructured nature of the data makes it challenging to quantify and report. However, log data is invaluable in a variety of use cases that involve tracking down exactly what occurred at a particular time.
Traces
Traces, short for distributed traces, are discrete forms of data occurring at irregular intervals. As such, the discrete nature of the data is often though of with a prefix of “the number of.” For instance, “the number of failed login attempts for a username or the number of seconds (duration) of a credit card transaction.”
A credit card transaction involves a series of steps including interfacing with the credit card’s service and the issuing bank’s backend services. This implies there are a number of services and transactions that collectively make the credit card transaction possible. Traces are the best fit for multi-service data correlation because traces offer mechanisms such as spans and correlation identifiers.
A span contains a start, end time, and correlation data such as span ID. A parent and child relationship together with the span ID makes grouping and of traces especially valuable when looking for anomalies in micro-services.
OpenTelemetry and AppDynamics
Developers can make sense of this data by instrumenting with OpenTelementry and sending telemetry data to Cisco AppDynamics, which now supports the open standard. The integration of OpenTelemetry with AppDynamics is a somewhat newer development that will ultimately provide investment protection, as code instrumented or the data produced with OpenTelemetry doesn’t need to be replaced should a developer decide to change vendors in the future.
Resources
Blog: Future-proofing Observability with OpenTelemetry
Learning Lab: AppDynamics Cloud, which supports OpenTelemetry
Article: What is OpenTelemetry?
Site: What is Observability?
Site: Cisco Developer FSO Hub