WAE Design Quick Start Guide
- Getting Acquainted with WAE Design
- Logically Group Nodes
- Create a Traffic Simulation
- What Can You Do With a Network Simulation?
Getting Acquainted with WAE Design
This quick start guide provides a sampler of some of the features provided by WAE Design. The exercises in this lab may be run using the following dCloud Lab:
Your task is to use an unprocessed network model in the WAE Design application to do the following:
Logically group nodes to make the topology easy to navigate
Create a traffic simulation using measured data from the network
[INFO] Some tasks in this exercise are usually performed during the collection and model building process of the WAE server. The WAE Design application is used in this exercise to demonstrate step-by-step details of that process.
Step 0 Launch WAE Design
- From the Desktop, Open the WAE Design directory
- The open the
MATEApplication
Step 1 Open A Network Model in Design
- From WAE Design, select File->Open. Navigate to the directory of the downloaded network model and select it. The file should be named “unprocessed-lab.pln”.
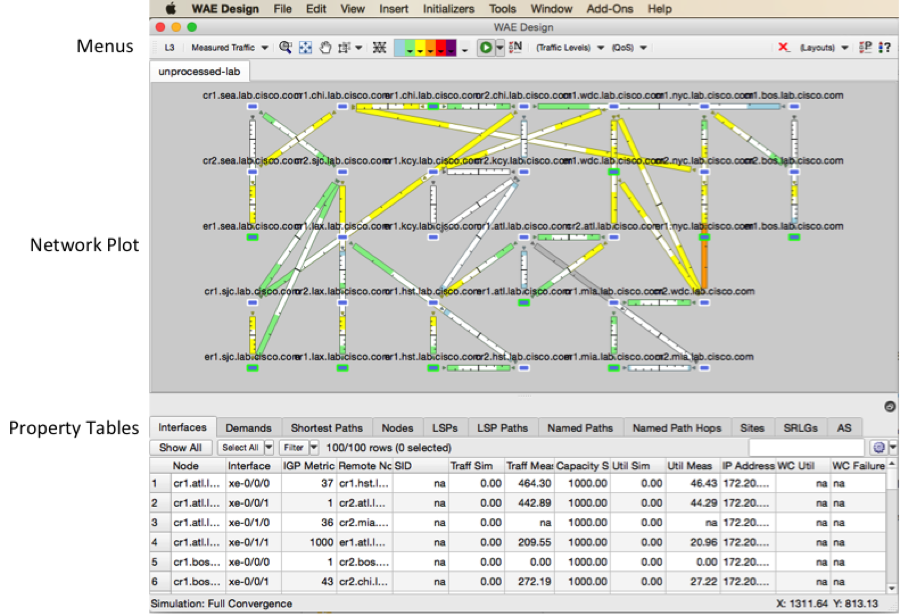
After the file opens take note of the following:
- You are looking at a multivendor network. WAE supports collection from Cisco, Juniper, Alcatel Lucent and Huawei.
- The network plot should show nodes connected by circuits. A circuit is two directly connected interfaces.
- You can click and drag nodes to change their position. You can also right click on an object in the plot or the property tables below to see available actions or filter to related objects.
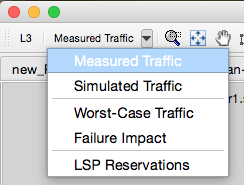
- In the upper left corner the selection box should say “Measured Traffic”. For now this traffic view should be the only selection that has colors appear on the interfaces.
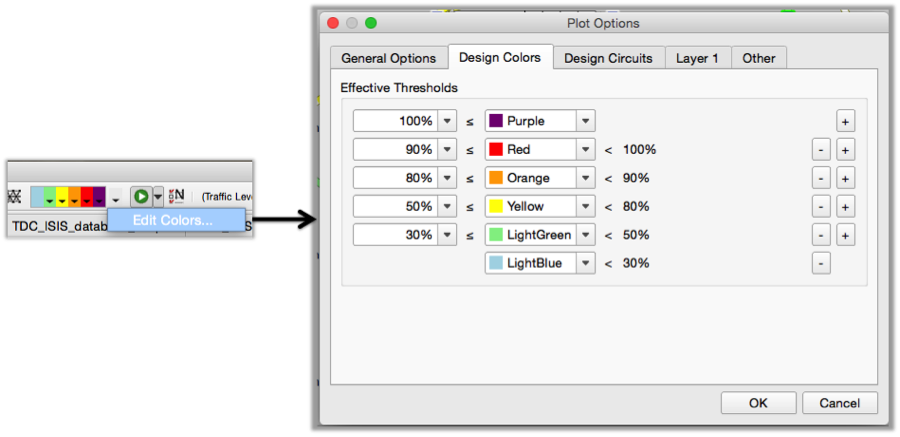
- The colors on the interfaces and the amount they are filled represent the measured egress traffic collected. The colors can be configured to represent other utilization values by selecting the “Edit Colors” selection box.
- The measured data in the model represents the period from which the data was collected from the network. This is the model used in the WAE Design application. There is another application called WAE Live that analyzes time series network models to derive trends, health issues and properties over time. WAE Live is not covered in this section.
Logically Group Nodes
The WAE network model allows you to group nodes together in a “site”. Additionally you can group a site in another site. The flexibility enables you to make complicated topologies simple and easy to navigate.
You can create a new site by selecting Insert->Site then assigning nodes to the site. However, by examining the node hostnames it becomes apparent the first stanza represents the node function, the second represents the node group and the third is the hostname suffix, which is the same for all nodes.
Step 2 Remove the Node Suffix
- De-select any node selections by clicking an empty part of the plot
- Select Initializers->Rename Nodes.
- Enter the suffix “.lab.cisco.com”
- Select OK.
Step 3 Assign Nodes to Sites
- Select Initializers->Assign Sites to Nodes.
- In the Nodes to Site Mapping Rules the delimiters being used are
.-and:. Since a.is being used to separate the nodes function and location, in the Site name: field use$2. - On the bottom left select Update Preview and observe what nodes will be assigned to each site.
- When finished press OK.
Step 4 Assign Locations to Sites
You should now see 11 sites. You can click and drag them around. Alternatively you can assign sites to geographic locations.
- De-select any site selections by clicking an empty part of the plot
- Select Initializers->Assign Locations to Sites.
- In the Location column, you can start typing a city, or just press enter to use tool to guess the location based on the site name.
- Notice that the guess gets the location of Houston and Kansas City wrong. Edit these rows by entering the correct city name and press enter to complete the row.
- When finished press OK.
Step 5 Arrange Sites According to Locations
To arrange sites in the plot according to the defined geographic locations:
- Select all sites (You can select all sites in the plot or you can select all sites from the Sites property table).
- Right click any empty part of the plot and select “Arrange”.
- You will see a small Arrange menu pop up.
- In the Arrange menu you can hover over each tool to see a description of what it does.
- Use the globe icon on the bottom right to arrange by the geographic locations.
- Now that the site locations are mostly clear, you can use other tools form the arrange menu to make the sites line up nicely or you can click and drag the sites around.
- When finished close the arrange menu.
Step 6 Create Custom Layouts
You may have a situation where you want to see many network views of sites or a subset of sites arranged in different ways. You can accomplish this by creating different layouts.
- Click on the “Layouts” selection menu in the upper right corner
- Select Edit Layouts.
- Select New and create two new layouts
- One named Geographic with type Design
- One named Waethermep with type Weathermap.
- Press OK when finished.
Step 7 Edit Custom Layouts
- Toggle the layouts drop down menu to the Geographic layout
- Right click an open space of the plot and select Plot Options.
- Under the General Options tab select Geographic and select Outline Background Map.
- You can also toggle over to the Design Circuits tab and make the minimum width bigger by entering 10.
- When finished press OK.
[DANGER] If you drag sites around using the geographic setting you are changing the sites set longitude and latitude.
- Toggle the layouts drop down menu to the Weathermap layout.
- You can optimally edit any of the same plot options properties used in the previous step.
- The key feature of the Weathermap type layout is you can click and drag on a circuit to curve it.
- When finished you should be able to toggle through each layout to see a different network view.
Create a Traffic Simulation
In the upper left corner of WAE Design, the selection box should say “Measured Traffic”. If you toggle to “Simulated Traffic”, the interfaces should appear empty. In this section we will use the measured data to create a traffic simulation.
WAE simulates traffic routed through the network using Demands. A demand represents an aggregate per service class flow of traffic from source to destination. Each demand has a traffic value in mbps and is routed according the topology and protocols as defined in the Network Model of the network.
Step 8 Create A Demand Mesh
To create a mesh of demands, first find the edge of the network. You will notice these routers are identified with hostnames er.<site name>.
In the Nodes property table, you can click on the node name column header to sort the nodes. Select only these nodes that begin with "er1" in the table.
Select Insert->Demand Mesh.
Under Sources: Nodes: Select "Selected in Table"
You can keep all the default options and select OK.
Step 9 Run Demand Deduction
Now the demands are in the model, but the demand traffic values are 0 (mbps). WAE has a tool called Demand Deduction that uses measured data from the network to determine what the demand traffic values should be.
[INFO] In this network we have collected SNMP traffic data on the interfaces. If you select an interface and filter to demands, notice that the sum of the demands going through the interface must equal the measured traffic value. If you were to do this on the entire network, you would begin to see a large system of linear equations. WAE Design has a tool called Demand Deduction that takes this, and other information into account to solve the per demand traffic values. NetFlow data can be used in helping determine the demand values, but NetFlow is not requirement for this process.
To run Demand Deduction
- Select Tools->Demand Deduction.
- You can keep all default values and select OK.
Now if you select the Simulated Traffic from the upper left drop down box you should see the links are colored according to their simulated utilization.
What Can You Do With a Network Simulation
The following tasks will take you through some of the things you can do with a network simulation.
If you have completed the previous steps, you can continue to use the same network model, or download the processed plan by clicking this button.
[DANGER] All the steps below assume you are starting with this plan.
What if Analysis
You can examine what happens if you change any aspect of the model.
Step 10 Examine a Few Scenarios
- What happens if a link fails?
- Right click on the circuit between NYC and WDC and select Fail
- What happens if you change a metric?
- Right click the circuit between LAX and HST and select Properties
- Change the Metric to 17
- Press OK
- What happens if you change the topology?
- Right click the circuit between CHI and KCY and select Duplicate
- When finished set the metric back and delete the extra link
- Right click and empty area of the plot and select Recover->
In the previous steps you have seen some of the simple cases you can examine with the simulation. Now lets look at some use cases.
Bandwidth on Demand and Traffic Engineering
[INFO] Make sure you have reversed any changes made in the previous step. WAE Design does not have an "undo" function so you need to undo any changes manually. You can always re-download and open up a copy of the model using the button below the heading "What Can You Do With a Network Simulation".
Before adding traffic to your network, you would like to know the impact the traffic would have. If there is congestion are there topology changes or optimizations that can be done to support the traffic?
Step 11 Bandwidth on Demand and Traffic Engineering
- Add a Demand
- Insert a new Demand by selecting Insert->Demands->Demand or right click and empty area of the plot and select New->Demands->Demand
- Give the Demand a name: new_traffic
- Give the demand a source: er1.bos
- Give the demand a destination: er1.mia
- Give the demand an amount of Traffic (mbps): 300
- Click OK
- Observe congestion on Interface: cr1.nyc GigabitEthernet0/0/3/0
- Add a MPLS RSVP Tunnel
- Insert a new Tunnel by selecting Insert->LSPs->LSP or right click and empty area of the plot and select New->LSPs->LSP
- Give the tunnel a type: RSVP
- Give the tunnel a source: er1.bos
- Give the demand a destination: er1.mia
- Click OK
- Select the LSP in the LSPs property table to observe its path.
- Optimize the Network
- Select Tools->RSVP LSP Optimization -> Tactical Explicit Opt
- Set Acceptable Interface Utilization %: 90
- Click OK
- A new Network Model will be produced, In the new plan select the LSP in the LSPs property table to observe the new path
- Delete the added demand and LSP to prepare for the next exercise by selecting them in their respective tables, right click and select Delete.
Capacity Planning with Resiliency Analysis
[INFO] Make sure you have reversed any changes made in the previous step. WAE Design does not have an "undo" function so you need to undo any changes manually. You can always re-download and open up a copy of the model using the button below the heading "What Can You Do With a Network Simulation".
You have simulated the impact to the network of a circuit failure. In Design you can also simulate what happens if a node, srlg, lag, l1 object or a site were to fail. If you were to go through each element one by one, you would get a "worst case" view of where you are most at risk of congestion and you would also get a view of the failures that case the worst case, the "failure impact". WAE Design has the Simulation Analysis tool to automate this process and provide that analysis.
WAE Design is also very extensible and provides an API that can be used to enhance the available tools. One example is an add-on called circuit upgrade. It will examine the simulation and determine what circuits should be upgraded and by how much.
Step 12 Capacity Planning with Resiliency Analysis
- Run Simulation Analysis
- Select Tools->Simulation Analysis
- Select Circuits to have the tool simulate one-by-one each circuit failure.
- Select OK
- Examine the Worst Case Traffic
- From the top left traffic view, select "Worst Case Traffic"
- To see a failure that cased the worst case, right click on an interface and select "Fail to WC", you will be taken to the Simulated Traffic view of that failure.
- Recover the failure by selecting an empty area of the plot and selecting recover->
<circuit>
- Examine the Failure Impact
- From the top left traffic view, select "Failure Impact"
- This view shows the impact of any failure. A circuit colored purple means that if that circuit were to fail, some interface somewhere would be purple.
- Run the Circuit Upgrade add on to see how much capacity you need and where
- Select Add-Ons->Circuit Upgrade
- Enter a Utilization threshold %: 90
- Enter BW Increment: 1000
- Enter Utilization Column: WCUtil
- Select Produced Resized Plan
- Click OK
- A new Network Model will be created and a report window will appear. You can see where new capacity was added.
- You can re-run simulation analysis on the new plan and see the worst case differences before and after
Capacity Planning and Forecasting
[INFO] Make sure you have reversed any changes made in the previous step. WAE Design does not have an "undo" function so you need to undo any changes manually. You can always re-download and open up a copy of the model using the button below the heading "What Can You Do With a Network Simulation".
You have simulated adding traffic to the network by adding demands. Using Design you can also apply a growth percentage to a demand or set of demands and project that growth into the future.
Step 13 Capacity Planning and Forecasting
- Apply a Growth Percentage to Demands
- Highlight sites NYC and WDC
- Right click the one of the sites and select Filter to Intersite Demands->with selected sites as source
- Select the demands in the table and open the Properties menu
- Apply a Growth Percentage of 30%. (This means you are estimating the demands will grow by 30% over the next time period.)
- Click OK
- Create Growth Plans
- Select Tools->Create Growth Plans
- Select Demand Growth Percentage
- Enter number of periods 3
- Click OK
- Observe the impact of the traffic growth. You can also run Simulation Analysis on this plan
Understanding the Create Growth Plans Options
Example 1:
You estimate demands grow 3% per week, so you apply a growth percentage of 3% to the demands.
You want to know what your network will look like in 1 year using Create Growth Plans
- Period Increment 52
- Number of Periods 1
Example 2:
You estimate demands grow 20% per quarter, so you apply a growth percentage of 20% to the demands.
You want to know what your network will look like after every 2 quarter for the next 6 quarters using Create Growth Plans
- Period Increment 2
- Number of Periods 3[INFO] Growth information derived from the WAE Live application can be imported into design. However, WAE live is not covered here.