JTAPI Case Opening Steps
For development issues and questions that cannot be addressed through the forum, you can open a case with Cisco’s Developer Support team.
For Solution Partner Program partners, this service is included in your Solution Partner Program memberships. You can also purchase tickets as needed basis directly from the site.
To help resolve your case quickly, please provide the following information when opening a developer support case:
- General description of the problem
- Is the problem reproducible or intermittent?
- Device Names, Directory Names (DN's)
- Observed vs. expected API behavior
- Version Number of CUCM
- Version Number of JTAPI
- JTAPI Logs ( Gathering detailed level JTAPI Logs )
- Cisco CTI/Call Manager Traces( Gathering CTI SDI/SDL Traces )
- Time Stamp of the Issue
Note : Please note that it is important to have matching CTI, CM, and JTAPI logs with the same time stamp covering the problem scenario.
Gathering detailed level JTAPI traces
- Step 1:
Go to Start > Programs > Cisco Unified JTAPI > JTAPI Preferences.
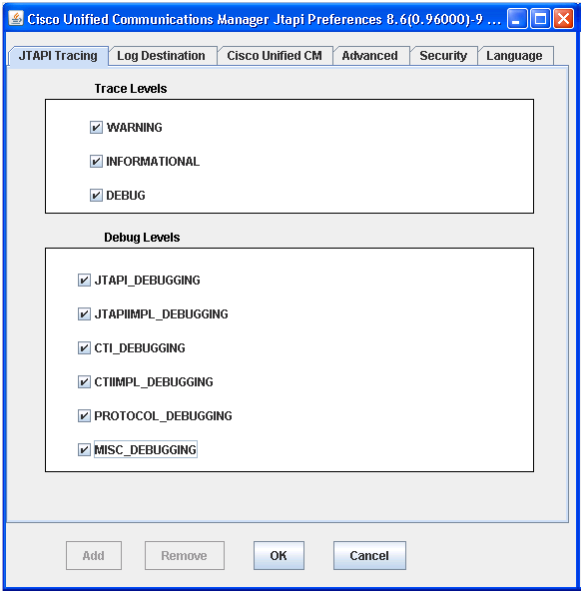
- Step 2: The JTPrefs application allows you to enable or disable various kinds of tracing.To turn on JTAPI traces run JTPrefs, and in JTAPI Tracing tab, select all the trace levels.
- Step 3: If DEBUG is enabled, JTPREFS allows you to enable/disable various debugging levels.
- JTAPI_DEBUGGING is used to trace JTAPI methods and events.
- JTAPI_IMPLDEBUGGING is for internal JTAPI implementation trace.
- CTI_DEBUGGING is to trace Unified CM events sent to JTAPI implementation.
- CTIIMPL_DEBUGGING for internal CTICLIENT implementation trace.
- PROTOCOL_DEBUGGING for full CTI protocol decoding.
- MISC_DEBUGGING-miscellaneous low-level debug trace.
Go to Start > Programs > Cisco Unified JTAPI > JTAPI Preferences.
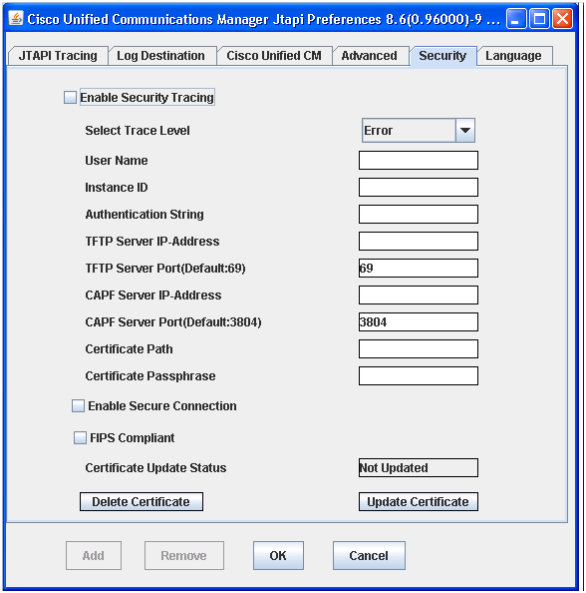
Different Tabs of the JTAPI Preferences window are as shown below:
- JTAPI Tracing Tab
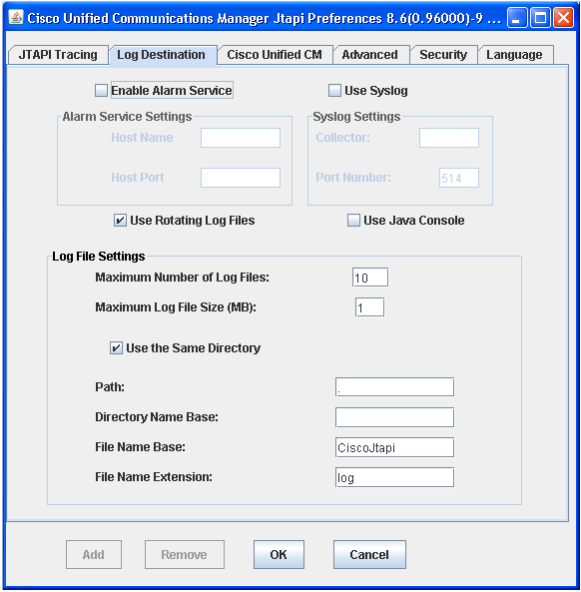
- Log Destination Tab
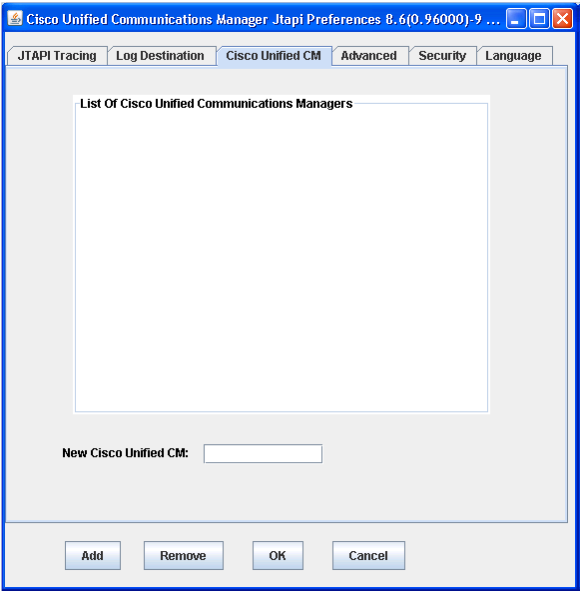
- Cisco Unified CM Tab
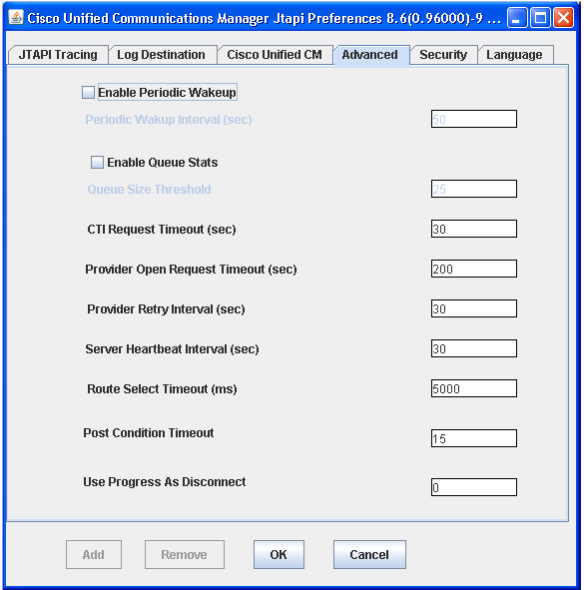
- Advanced Tab
- Security Tab


Gathering CTI/CM (SDI/SDL) Traces
- Please enable the following on Call Manager Side to collect CTI-SDI traces.
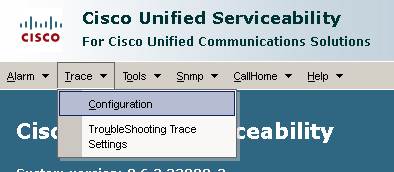
- From Cisco Unified Serviceability go to Trace and select Configuration
- Select the server and click Go. Select CM Services and click Go. Select Cisco CTIManager(Active) and Click Go.
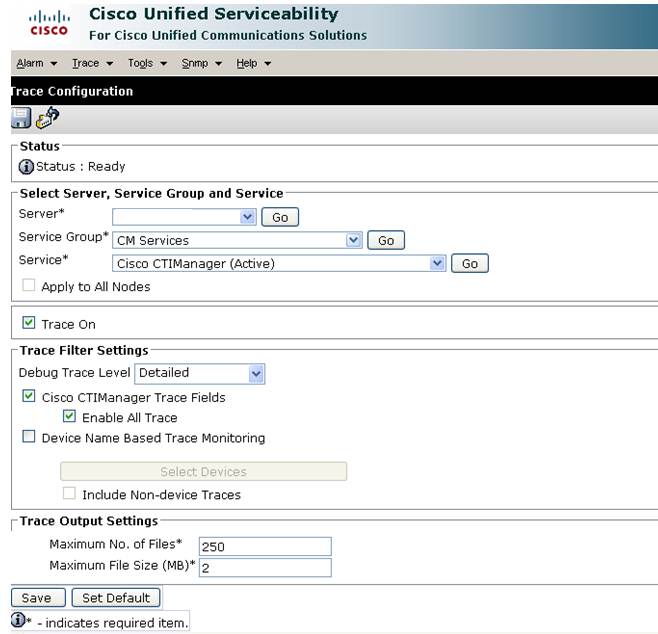
- Check the Trace Output Settings, if there is a large amount of traffic, you may need to increase the number and/or size of the files to ensure they are not overwritten too quickly. For this purpose leaving this column default is fine.
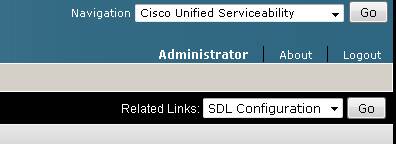
- Select Select SDL Configurations in related links and do similar configurations to collect the CTI SDL Traces.
- Please Enable the following on Call Manager Side to collect CCM-SDI traces.
- From Cisco Unified Serviceability go to Trace and select Configuration
- Select the server and click Go. Select CM Services and click Go. Select Cisco CallManager(Active) and Click Go.
-
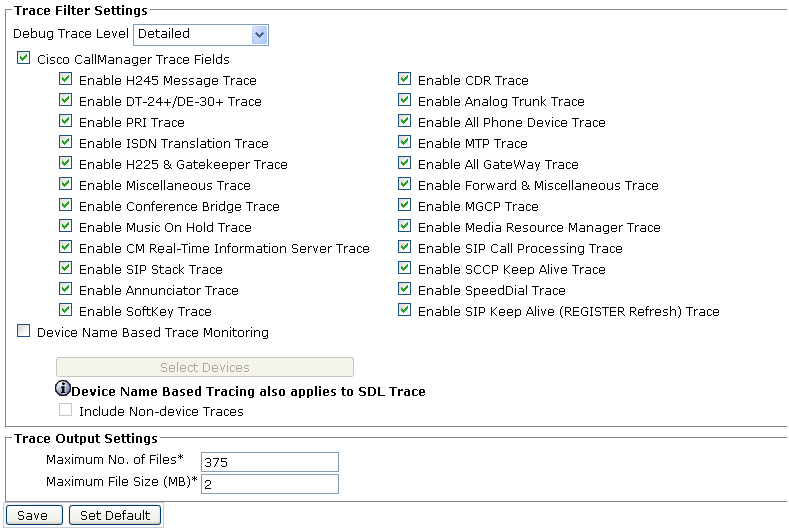
- Check the Trace Output Settings, if there is a large amount of traffic, you may need to increase the number and/or size of the files to ensure they are noy overwritten too quickly. For this purpose leaving this column default is fine.
- Run the test (The application you want to test or which is creating the issue).
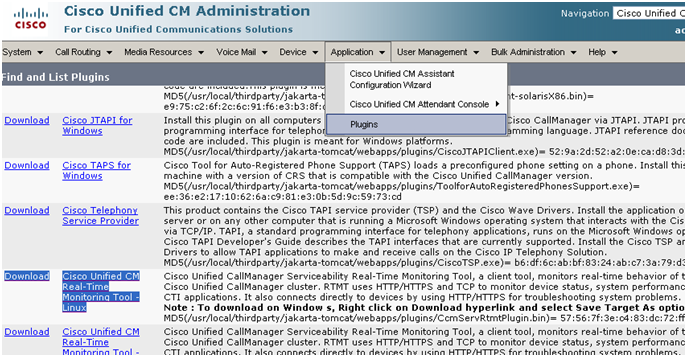
- If you don't have the RTMT tool, Download it from the Call Manager Admin Page -> Application -> Plugin.
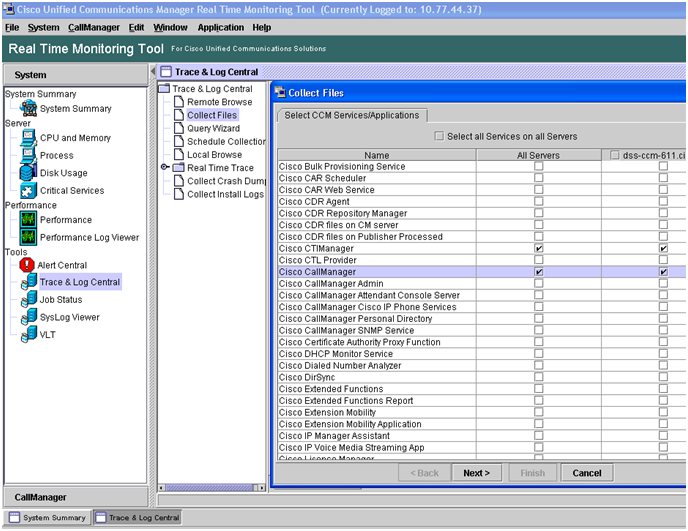
- Now, using the RTMT Tool, you can collect the CCM/CTI (SDI/SDL)traces, for that connect to CM and select Trace&Log Central and/or double click on collect files. Check all the servers for Cisco CTIManager & Cisco CallManager
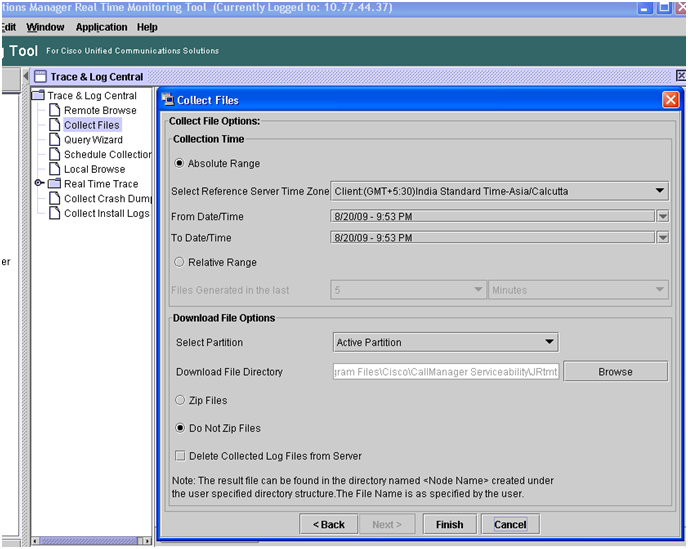
- On Collect File option screen, Select an Absolute range approximately 30 minutes before and after your test run. To zip the files is a convenient option. Please e-mail or attach these files to your case using the on line TAC case tool.


