How to improve system and application health in cloud-native environments
The key to proactive observability are regular, well-defined application health checks
Estimated time to read: 11 minutes
The need to understand system and application health has remained a top priority for IT and DevOps teams throughout the past decade. More recently, the cloud environment has complicated the methods used by developers to understand system and application health. Simple monitoring once was the method of choice — before microservices and multi-cloud environments entered the picture. Now, monitoring multiple systems only further complicates an already complicated system.
To make sense of this complexity, track application health, and glean actionable insights to improve systems, developers have been turning to full-stack observability.
In this article, we’ll take a look at how cloud-native environments have changed the way developers monitor their systems and dive into the charge leading the era — full-stack observability — and explore how it can help developers quickly respond to system degradation and failures.
Challenges of monitoring cloud-native applications
Cloud-native applications have gained popularity due to a number of features that are important in todays world. However, the same features that allow cloud-native applications to be dynamic and scalable make them more complicated to monitor using traditional monitoring methods. This section will explore how the features that make cloud-native applications popular have also challenged monitoring.
Challenge 1: Dynamic and scalable applications
Immutable infrastructure is a fundamental feature of cloud-native applications. The idea behind immutable infrastructure is, when a resource is obsolete or even malfunctioning, you replace it completely, instead of updating it in place. Because of this, cloud-native applications (like those orchestrated by Kubernetes) have the following dynamic features:
- Applications run in containers with short lifespans
- Traffic is shaped dynamically using service meshes
- Systems are scaled intelligently
All of this is in stark contrast to traditional applications deployed on fixed, known hardware. Monitoring is complicated by this fluidity.
Challenge 2: Highly distributed systems
Cloud-native applications are extremely microservices-oriented. They run on different platforms and produce different log and metric formats in order to improve overall agility and maintainability. However, this introduces challenges in standardization. These complex interactions and dependencies make it difficult to get a firm grasp on understanding your system. As an added challenge, services can be spread across locations and cloud providers. This highly distributed nature requires a much more complex approach to understanding the health of the system. Different services are often maintained by separate teams, which makes propagating the right amount of context between teams difficult.
Quick win to overcome this challenge: We’ll talk about the solutions to these challenges later in the article, but a quick tip to reduce this complexity: These complex interactions between services can be managed by using service meshes. Service meshes provide service discovery, load balancing, traffic shaping, failure recovery, and policy enforcement. Observability in cloud-native environments can integrate with service meshes to offer a complete and coherent picture of the system.
Challenge 3: Rapid evolution, automation, and CI/CD processes
There is an emphasis on automation and Continuous Integration/Continuous Deployment (CI/CD) processes with cloud-native apps. While this rapid evolution offers benefits in terms of speed, reliability, and efficiency, it has implications for application monitoring. Monitoring often can’t keep up with the speed of changes going to production and rolling deployments. Further, these changes produce a large volume of non-uniform data that traditional monitoring systems can’t anticipate and diagnose new types of failures coming from updated systems.
Challenge 4: Unknown failure modes
On a similar note, traditional monitoring approaches expect failure in a clearly understood and defined way. However, the new features outlined above introduce new failure modes that are unknown and unpredictable. New kinds of failures take longer to detect and fix.
Quick win to overcome this challenge: Cloud observability platforms can surface issues and relevant information without being configured for specific problems. Instead of taking a reactive approach, i.e., monitoring for failures that are already known, cloud systems demand a proactive approach where tooling can detect and report deviations from desired behavior and present it in an actionable way.
Solutions to improve system and application health
The following section will dive into how developers can battle the complexity explored above, and improve their system and application health through setting SMART goals, practicing visual data analysis, and, of course, moving towards an observability-first, proactive approach.
Solution 1: Set clear observability goals
A good monitoring approach is grounded in business goals. Plain systems monitoring is a thing of the past. With cloud-native applications, the complexity and fluidity of the architecture means that it’s simply not feasible to figure out all failure modes ahead of time.
This is why the practice of site reliability engineering (SRE) embraces failure. Simply witnessing failures is useless without the context of end-user impact. For example, if certain clustered web application servers fail in a cloud-native system that typically supports auto-healing, you don’t have to take any action. If certain errors happen within acceptable thresholds (error budgets), engineering time is better spent elsewhere.
To understand what to monitor, a developer needs to determine how services are being delivered to the end users, and the business impact of these services. Observing digital touch points with customers should be associated with the applications that power them. Similarly, observing the applications themselves should be associated with the infrastructure and platforms they run on.
Set “SMART” goals
You have to know what you want to achieve to figure out what to measure. The SMART framework lets you come up with goals that are Specific, Measurable, Attainable, Relevant, and Time-Bound.
Your observability practice should allow you to associate measurable business KPIs or metrics with your application performance and the platforms and infrastructure that run it.
Solution 2: Implement full-stack observability
Teams need a holistic understanding of their system health by observing and correlating the different layers of their IT stack and business goals. Unfortunately, these various layers often use disjointed tools.
Let’s take an example of a large e-commerce store selling products in multiple cities and consisting of various teams (e.g., engineering, business analysts, and leadership), where degraded infrastructure is ultimately leading to a drop in sales. The following table shows how different teams of an organization focus on their specific views of the system, leading them to different issues they deem important.
| Category | Example |
|---|---|
| Business KPI Monitoring |
|
| Application Performance Monitoring |
|
| CI/CD Dashboard |
|
| Real User Monitoring |
|
| Synthetic Monitoring |
|
| Error Tracking |
|
| Infra Monitoring |
|
If your biggest contributor to lower sales is abandoned carts due to the busiest city being served by a data center where there are packet drops caused by a misconfiguration in the networking stack. It’s difficult to prioritize fixes for an issue causing the biggest business impact between different layers of the IT architecture. Traditional approaches are siloed. Approaches that don’t contextualize and correlate the telemetry data they collect also fail to gauge the overall impact of cascading effects throughout the system.
All of this leads to competing ideas about how to address problems, which makes prioritizing solutions difficult. Having full-stack observability enables teams to communicate, agree on the root causes, and align on common goals thereby improving cross-functional collaboration.
Full-stack observability provides the ability to determine a system’s health across all components of the technology stack.
Remediation and collaboration are simple when observability consolidates all the siloed information from different tools into one platform.
Solution 3: Practice effective data analysis using visualization and reporting
Understanding user needs is key to designing dashboards and reports that deliver users the information they need in an accessible format. This user-centric approach minimizes cognitive load and maximizes comprehension.
Visualization can be a powerful tool in this process. Here are some examples of various forms of visualization.
Tables
Tables provide detailed values of metrics with high precision where current values are more relevant than historical values or trends.
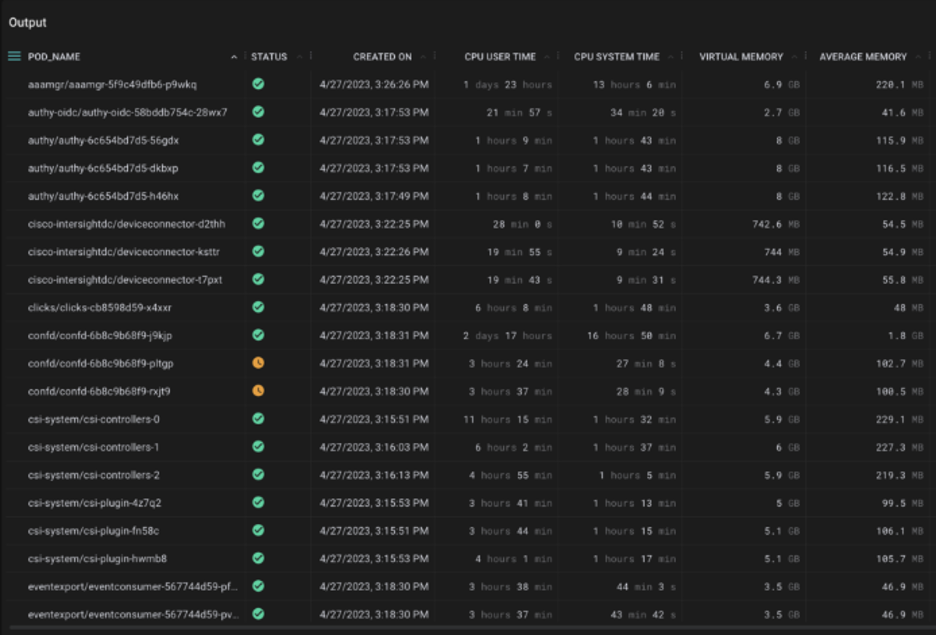
Figure 1: Table visualization showing data about pods and their CPU and memory utilization (Source: Cisco)
Graphs
Graphs are one of the most popular visualization techniques in full-stack observability. They’re good for showing data trends over time and also help in correlating multiple metrics.
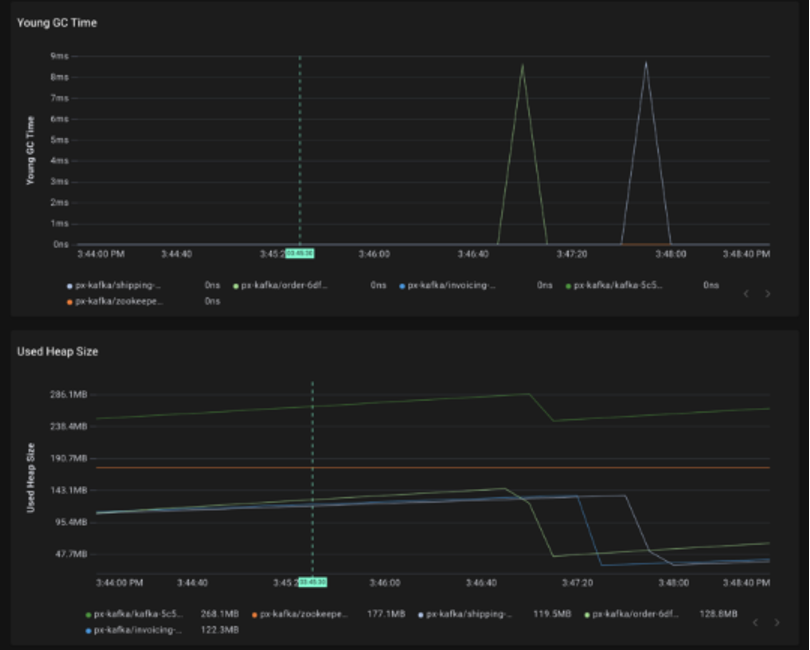
Figure 2: Graph visualization showing GC time and heap size of the Kafka service. (Source: Cisco)
Flame graphs
Flame graphs, made popular by Brendan Gregg, help visualize hierarchical data and are widely used to uncover performance hotspots.
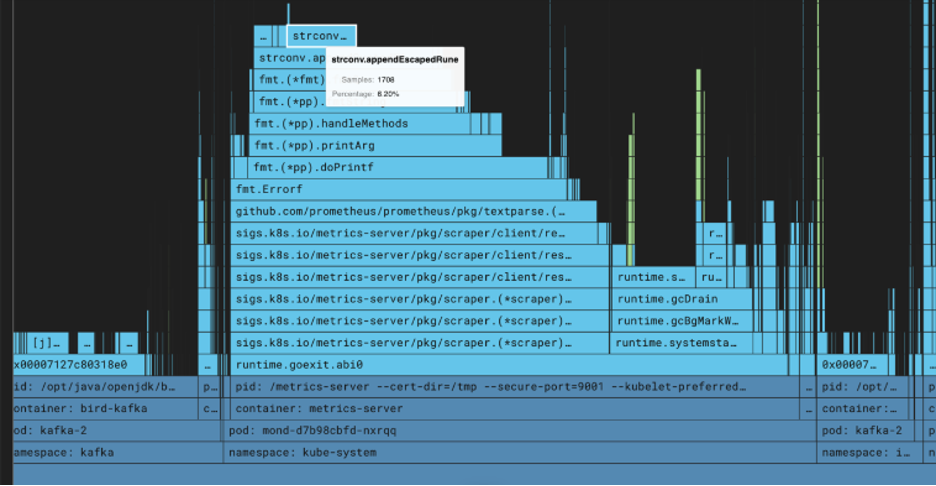
Figure 3: Flame graph of the Kubernetes Metrics Server showing time spent by each function call in the stack trace (Source: Cisco)
Counter and Gauge Charts
A counter or gauge chart shows the current value of a given metric, along with capacity or a higher limit. A good example of this is for showing CPU utilization or application health.
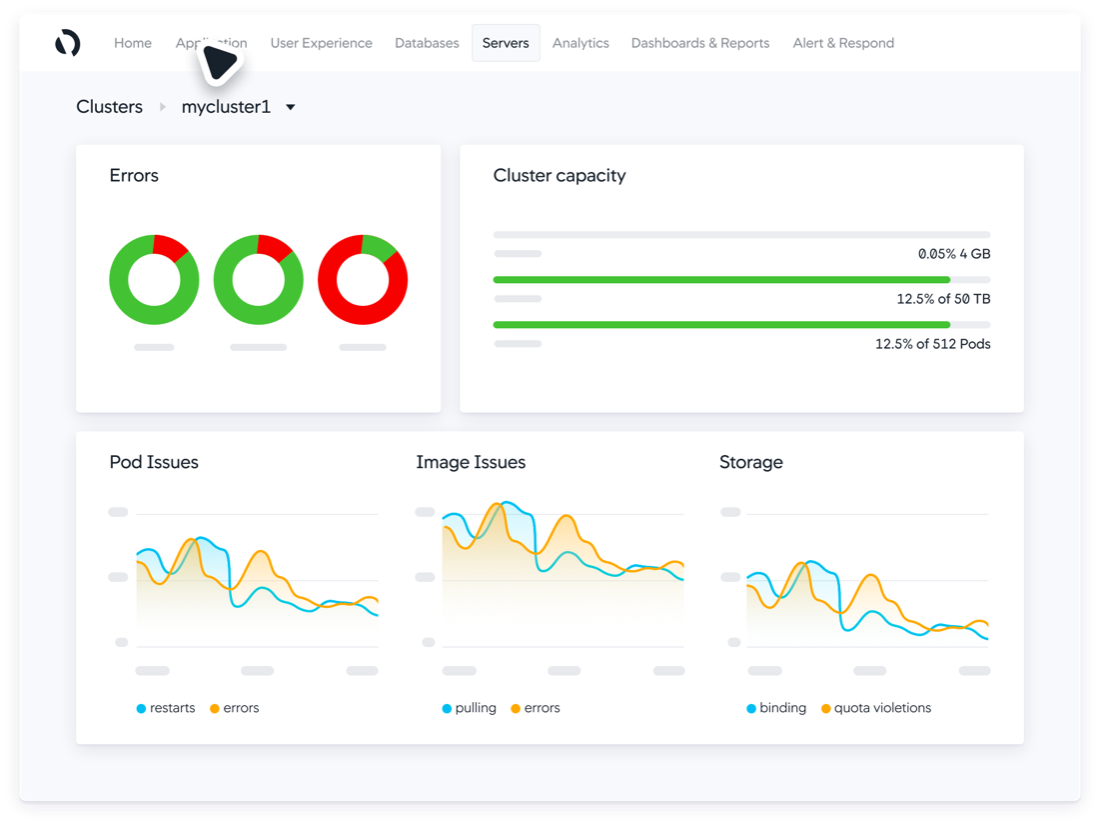
Figure 4: Application health shown on a gauge chart (Source: Cisco)
Geographical Charts
Geographical charts show spatial data and distribution across locations. An example is the number of active users in different parts of the world.
Stacked charts
An extension of a graphical visualization, a stacked chart helps show trends of multiple items on the same axis, as well as their individual share and accumulated value.
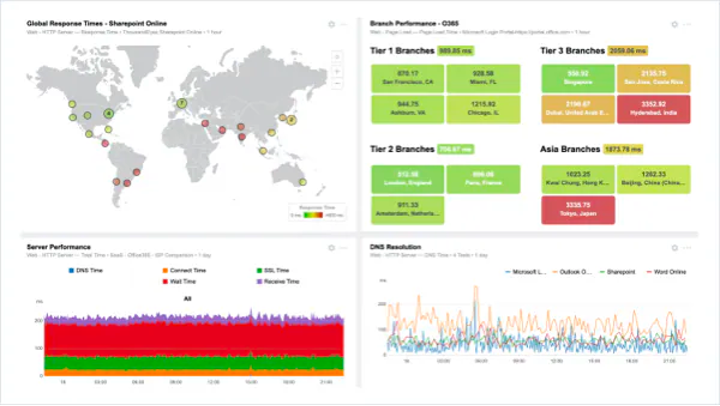
Figure 5: Geographical and stacked charts on Cisco ThousandEyes dashboard (Source: Cisco)
Service maps and topology
A service map is useful for displaying services and their relationship with each other. It also shows additional metrics such as traffic or latency and hierarchy. This is particularly useful in the distributed systems and microservices paradigm.
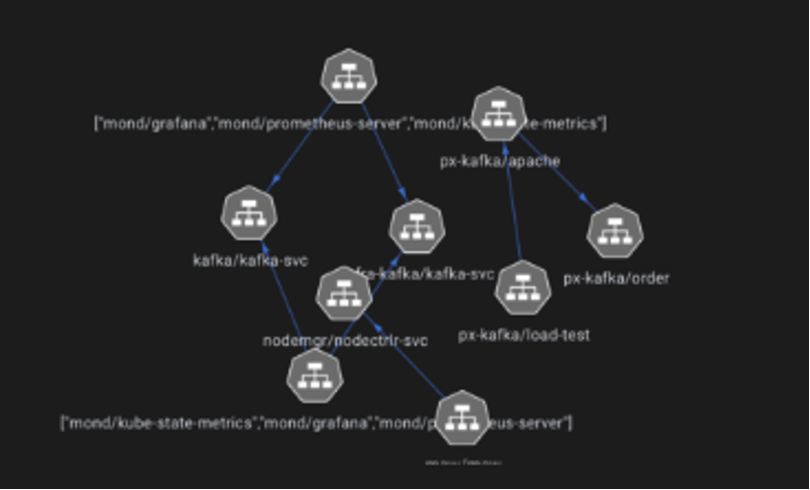
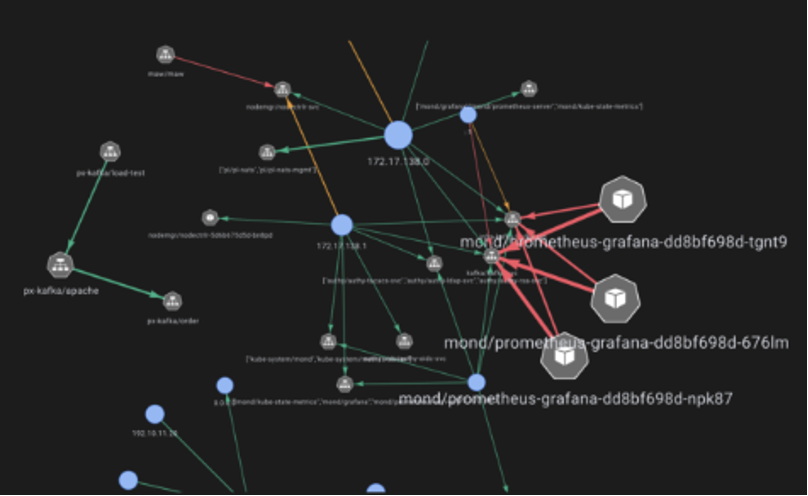
Figure 7: Service maps showing various Kubernetes services and their relation with each other. (Source Cisco)
Visibility, insights, and actions
It is imperative for an observability platform to be able to provide visibility, insights based on this visibility, and recommend actions. To do so, the platform must correlate traces with their corresponding logs and metrics at a particular point in time. Moving beyond siloed metrics, a holistic approach to monitoring enables proactive identification of cascading issues across systems. Logs record events deemed important to the business or software, adding context to the metrics you’re seeing. Traces track the end-to-end behavior of a distributed system, offering insights into what is happening to a request at any point in the application. When combined with metrics and logs, traces can provide a fuller understanding of performance or bugs you’re trying to remediate.
Organizations can also leverage AI and data science to report issues proactively via anomaly detection. Intelligent correlation searches can surface issues across seemingly disparate components. This is especially useful in highly distributed and fast-changing applications where unforeseen problems are likely to arise.
Maintain security and compliance
Another important dimension of system health is security and compliance adherence. Observability platforms can monitor for vulnerabilities, threats, attacks, and misconfigurations in real time to trigger alerts and automated remediation workflows.
Compliance monitoring can oversee the status of various cloud-native assets like security groups, storage buckets, and load balancers, identifying any misconfigurations or violations of established policies.
Platforms can also have popular compliance frameworks such as PCI DSS and CIS benchmarks built in, which facilitate mandatory compliance when aided by application and infrastructure monitoring.
Tips to implement full-stack observability and improve system and application health
An observability platform has to turn all of this information into valuable insights for various teams and provide context that improves the understanding of the system end to end. The following tips will help you get the most out of your observability platform.
1. Implement standardization
When you’re running microservices across multiple teams and platforms, it’s difficult to keep up with your observability needs. Standardizing log formats, metrics emission, and collection, along with templatizing dashboards, reduces the effort required to set up observability for new services; it also promotes knowledge sharing.
2. Practice efficient alerting and incident management
Make sure to prioritize alerts and set up an escalation policy. And be wary of overly aggressive alerting — if everything is urgent, nothing is urgent.
Proactively adjust thresholds so that alerts are actionable. Being continually exposed to alerts where no action is needed desensitizes us to them. This is called alert fatigue and leads to missed alerts or even burnout in folks experiencing it.
Alerts should also contain information that gives responders context and helps them come up with a potential fix faster. This could be the right people to reach out to, incident response runbooks, and other documentation.
3. Adopt continuous learning and improvement
Observability should be used to implement a continuous review and improvement process for system reliability, performance, and efficiency. This allows you to make data-driven decisions around what the most pressing concerns are and where efforts are most likely to yield the best results.
For every issue that escapes into production, take the lesson learned and improve detection and remediation. Each failure should make your system more reliable.
4. Pick the right tools
There are multiple dimensions to picking the best tools based on your constraints and goals. You need a platform that enables you to be goal-oriented and implement full-stack observability.
Be wary of vendor lock-in and prioritize tools that support standard protocols like OpenTelemetry. These enjoy broader support and are also more extensible and customizable.
Another productive choice is choosing a platform that has good out-of-the-box integrations and auto-instrumentation support for your particular technology stack.
Modern platforms also recognize the scale at which cloud-native systems operate, offer data-tiering and intelligent sampling, and leverage new technologies like eBPF for better cost efficiency.
In today's environment, observability is the key to application health
By adopting the right practices, mindset, and tooling, organizations can excel in the demanding landscape of cloud-native systems, properly observing and maintaining good system health.
The industry understands the challenges of implementing effective cloud observability and has recognized platforms like Cisco Observability Platform and that are designed specifically to address them.
Good luck in your cloud-native transformation journey!
Additional Resources and Links:
- Article: What are the Golden Signals?
- Hub: Cisco Developer Full-Stack Observability Hub
- EBook: Cisco Full-Stack Observability
- API Tutorial: Health Rules with Cisco Cloud Observability
- Sample Code: Use health rules to monitor entity health with Cisco Cloud Observability
- API Doc: Cisco Observability Platform Health Rules API