What to Look for in Application Performance Monitoring Tools
Application monitoring has become more complex in a cloud-native environment. Luckily, there are tools that are up for the task.
Time to read: 9 minutes
Application performance monitoring (APM) isn’t just about keeping your systems running. It’s the backbone of operational excellence, driving cost-effectiveness and offering invaluable insights for continuous improvement.
As systems increase in complexity, APM has become slightly more challenging using historical methods. However, there are tools that feature automation, scalability, and simple user experience that are up for the job. In this article, we will learn about the important features of an effective application monitoring tool and provide best-practices in selecting one.
How to monitor a modern, dynamic system
Traditional approaches to monitoring depend on a prior understanding of how systems fail. This is an obstacle when dynamic systems (like cloud-native applications) can fail in new and unpredictable ways.
Modern monitoring tools for cloud-native applications must be able to correlate data across different contexts and surface issues without any explicit configuration. For instance, an error reported by a mobile app should be easily traceable to the exact change in one of the dozens of microservices that power its backend. This enables engineers to perform root cause analysis (RCA) and achieve faster resolution. Even better, if you can get feedback about the metrics on new rollouts, you can use it for an improved deployment strategy, such as canary or blue-green, to automatically roll back a bad change and remediate the issue.
To get the most out of monitoring, you’ll need to select a modern monitoring stack that has abilities like the above to monitor cloud-native systems and applications.
Key features of effective application monitoring tools
Ideally, you’ll want one or a few APM tools that check the following boxes:
- Are as effective as possible to justify their costs
- Avoid context switching
Let’s look at the key features in an effective application monitoring tool.
Feature 1: Comprehensive monitoring capabilities
There are four primary telemetry data types: Metrics, events, logs, and traces, a group known simply as MELT:
- Metrics: Quantitative data that measures system performance like CPU usage and memory consumption
- Events: Specific occurrences or changes in the system, often signaling important system states
- Logs: Detailed records of events, providing insights into how the system operates
- Traces: A record of the path of requests through the system, useful for understanding the flow and performance of individual operations
A monitoring tool must collect, visualize, and correlate all four of these effectively for robust application monitoring.
Feature 2: Ability to monitor unknown unknowns
Some metrics like application throughput are based on user traffic patterns that can change depending on the time or season. Due to the unpredictability of these metrics, you can’t set fixed alert thresholds. A monitoring tool should be able to surface deviations from desired behavior without any specific configuration while providing a way to tailor alerts.
Anomaly detection in time-series data plays a key role in monitoring system performance, as it’s adept at spotting unexpected variations in metrics like CPU usage, network traffic, and error rates. In the realm of logs, it pinpoints irregular user activities and security concerns. This approach becomes more powerful when correlating varied telemetry data types.
By linking anomalies found in logs, metrics, and events, anomaly detection facilitates robust and automatic root cause analysis.
Feature 3: Alerting and incident response
Application monitoring isn’t very effective if you’re not notified of meaningful events in the system. A monitoring tool should be able to alert in real-time on both customizable thresholds and anomalies.
The platform should be able to group related alerts into incidents and enrich them with context to make resolution easier, including:
- Associated events
- Telemetry data
- Incident response runbooks
- Contact people
A good monitoring tool may even intelligently route incidents to the teams or individuals best equipped to resolve them, as well as trigger remediation workflows conditionally, further relieving operational burden.
As the saying goes: if everything is urgent, nothing is urgent. Alerts firing all the time will only lead to on-call personnel getting overwhelmed and desensitized, rendering alerts counterproductive. Your monitoring tool must allow for intelligent suppression, prioritization, integration with existing tools, and escalation of alerts by automatically making needed adjustments or providing recommendations.
Feature 4: Data-driven analytics
Analytics from telemetry data enable a data-driven approach essential for continuous improvement and maintaining high service standards. Metrics to follow here include mean time to repair (MTTR), mean time to acknowledge (MTTA), and other service-level objectives (SLOs).
Proper examination of the right data lets you identify areas in need of improvement, which can boost efficiency across the entire system. Analytics also aids post-mortem analyses, providing insights into incidents to prevent future occurrences and optimize system performance.
Feature 5: Integrations
Monitoring tools should offer a wide array of integrations across your tech stack, open standards, and third-party services. Some of the most popular integrations to look for in a monitoring tool include those that support:
- Good out-of-the-box experience with all popular languages and application frameworks including Java Spring, .NET MVC, Node.js, and Express.js, as well as databases like MySQL, PostgreSQL, Redis, Cassandra, and Elasticsearch
- Open-source standards such as OpenTelemetry, OpenMetrics, and StatsD, and tooling like Fluentd, Grafana, and Prometheus
- Container and orchestration platforms for monitoring containerized environments such as Docker and Kubernetes
- Security tools like Snyk for early and continuous vulnerability scanning
- Incident management systems for alert escalation like PagerDuty or Opsgenie
- CI/CD tools for deployment tracking such as Jenkins or GitLab
- Cloud platforms for cloud resource monitoring Cisco Cloud Observability
- Collaboration tools for team communication like Cisco Webex
- Business intelligence tools for correlating application performance with business metrics
Feature 6: Scalability and cost management
Modern applications are operating at ever-increasing scales and complexities, leading to higher monitoring costs that can become difficult to justify.
Monitoring tools can help proactively manage scalability. First, they can optimize infrastructure costs by identifying stale and over-provisioned resources, as well as forecast future resource needs based on trends. This helps create effective budgeting and cost-saving measures like securing committed usage discounts from your cloud provider.
Second, a monitoring platform should help manage the cost of observability by using downsampling to reduce the amount of data ingested and make data retention configurable. Meanwhile, intelligent and adaptive sampling ensures no critical data is missed. By classifying and tagging telemetry data, you can implement fine-grain retention policies to further reduce the burden on the observability platform.
It should also be noted that modern platforms like the Cisco Observability Platform are better at managing and storing high cardinality data and utilize more efficient technologies like eBPF for higher cost-efficiency.
Feature 7: Good user experience
The UI/UX of an APM tool is crucial to efficiently correlate and visualize information for debugging and gathering actionable insights.
Advanced APM solutions offer features like issue maps, which provide clear visualizations of system components and consolidated information. These are instrumental in isolating problems and understanding their impact for quick resolution. Your tool should also have a plug-and-play experience for your stack via pre-configured dashboards and easy integration with your apps.
Good documentation is also key. This helps engineers effectively utilize the tool and know what to expect from it.
Feature 8: Ease of operations
The expertise for what to monitor, how to effectively utilize observability, and operating the observability stack itself may require different teams and individual expertise. Utilizing “everything-as-code” helps maintain observability at scale by encouraging reuse and standardization; it also lets you track and revert changes.
Automation-friendly monitoring platforms that integrate with modern app platforms, have a robust and well documented API, and offer infrastructure and configuration management tools, lower the operational burden.
Additionally, vendor-neutral instrumentation has become an increasingly desired feature. Tools that support OpenTelemetry provide flexibility for organizations.
Feature 9: Cost efficiency
The amount of data required for complete observability can increases quickly, leading to both high spend and performance issues. Having data lifecycle management and multi-tier data storage for metrics, logs, and traces can help keep costs in check and maintain performance.
Innovative storage techniques such as compression, deduplication, data sampling, and automatically handling high-cardinality data are important factors when selecting the right product.
Selecting the right APM tool
When selecting an APM, assess your organization's unique needs and constraints. These include system complexity, user base, scale, budget, and team skills. Full-stack observability (FSO) is also crucial for alerting on then tying symptoms to the root causes of issues.
Make sure to choose a tool that integrates seamlessly with your current tech stack, DevSecOps processes, and workflows, ensuring ease of adoption and operational synergy.
Balancing comprehensive insights with practical considerations like resource constraints and existing infrastructure is key to finding an insightful and feasible tool for your organization.
APM tools for real-life use cases
Let’s take a look at a few examples of how to monitor popular platforms such as Kubernetes and AWS Lambda, and how to implement AppDynamics to help.
Example 1: Using APM tools for monitoring Kubernetes deployments
Kubernetes has become the most popular container orchestration platform and forms the backbone of most cloud-native architectures today. It has unsurprisingly been dubbed the “operating system of the cloud.” However, monitoring Kubernetes presents unique challenges due to its dynamic and complex nature.
Kubernetes orchestrates containers across multiple nodes, and each containerized app has various components in Kubernetes that are related to the application. This complexity is compounded by the ephemeral nature of containers, which can be created and destroyed rapidly. Additionally, Kubernetes' use of abstraction and automatic scaling adds layers of complexity to monitoring resource allocation and utilization.
These factors make Kubernetes monitoring distinct from traditional monitoring, requiring specialized tools and approaches to effectively manage and observe its performance and health.
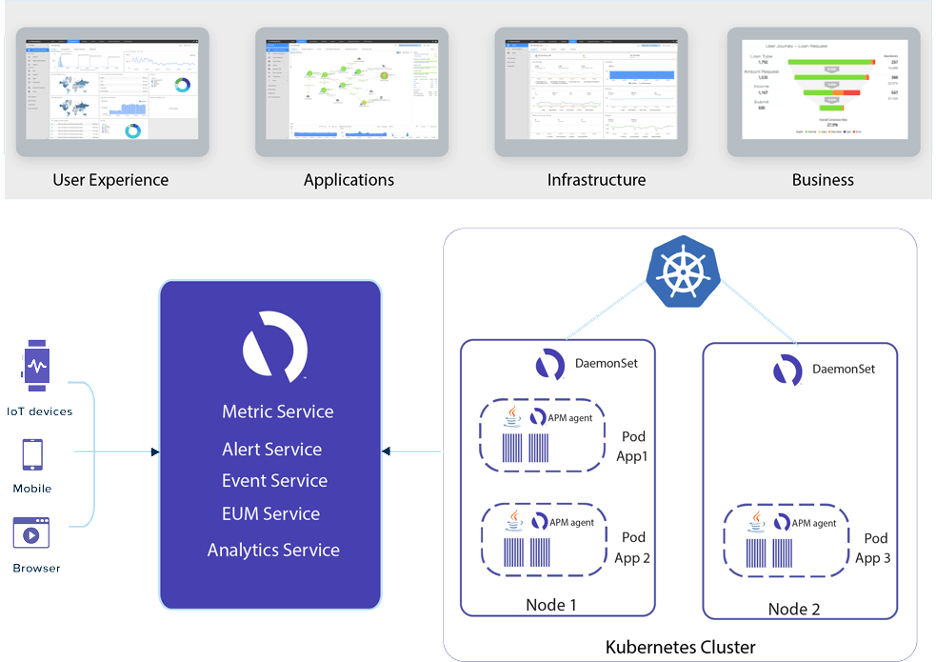
Figure 1: Kubernetes Monitoring in AppDynamics (Source: Cisco blog)
The tools: Cisco AppDynamics and Cisco Observability Platform
Cisco AppDynamics for Kubernetes empowers enterprises with comprehensive capabilities.
In the pursuit of end-to-end visibility, AppDynamics offers a detailed perspective from end-user touch points, spanning browsers, mobile apps, and IoT devices and extending to the Kubernetes platform. It furnishes line-of-code-level insights for all deployed applications, whether traditional or microservices.
The platform additionally provides granular metrics on Docker container resources, infrastructure metrics, log analytics, and the performance of each database query.
All these aspects are seamlessly correlated within the context of business transactions, offering a logical representation of end-user interactions. This approach helps developers communicate across silos, allowing them to utilize existing skill sets and processes to monitor both Kubernetes and non-Kubernetes applications through a unified monitoring solution across diverse hybrid cloud environments.
Cisco AppDynamics for Kubernetes also expedites root-cause analysis with its unique machine learning (ML) capabilities, simplifying the identification of the root cause of failures. Other features of AppDynamics for Kubernetes include the ability to tag metrics such as customer conversion rate or end-user experience to correlate Kubernetes performance metrics with business metrics. Health rules and alerts based on these business metrics offer intelligent validation, ensuring that every code release contributes to meaningful business outcomes.
Finally, AppDynamics Machine Agent provides a seamless, out-of-the-box experience by deploying Kubernetes as a DaemonSet on all worker nodes. This leverages Kubernetes' capability to ensure constant agent operation and performance data reporting.
For a more complete observability picture users can monitor Kubernetes environments with the Cisco Observability Platform, which provides observability for Kubernetes workloads using extended Berkeley Packet Filters (eBPF).
Example 2: Using APM tools to monitor serverless architectures
Since serverless architectures are a bit different from traditional services, you need a specialized UI for them that focuses on things like an event trigger, a breakdown of the invocation time, cold starts, and throttling.
The AppDynamics platform integrates with serverless architectures like AWS Lambda to monitor with more contextual information. AppDynamics’ serverless APM correlates between various serverless functions, providing a better understanding of business transactions.
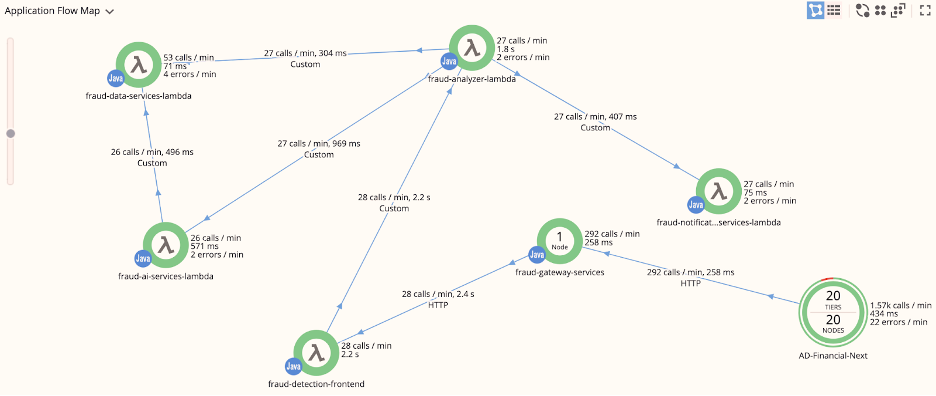
Figure 2: AppDynamics’ serverless APM (Source: AppDynamics docs)
The checklist for the right APM tool is dynamic to your organization
Choosing the right APM solution requires a thoughtful look at your organization’s specific dynamics, from the complexity of your systems to the nuances of your team’s capabilities and budget. Embracing full-stack observability is crucial, as it bridges the gap between outcomes, their symptoms, and their root cause.
Opt for an app monitoring tool that integrates smoothly with your existing technology, ensuring it's a boon, not a burden, to your operations. The goal is to find a solution that’s not just data-rich, but also practical and manageable within your organization’s unique ecosystem.
Resources:
Hub: Full-stack observability hub
Platform: Cisco Observability Platform
Article series: Mastering Kubernetes in Production Environments