Dashboard
To bring your data to life, build an interactive dashboard with the node-red-dashboard node.
Overview
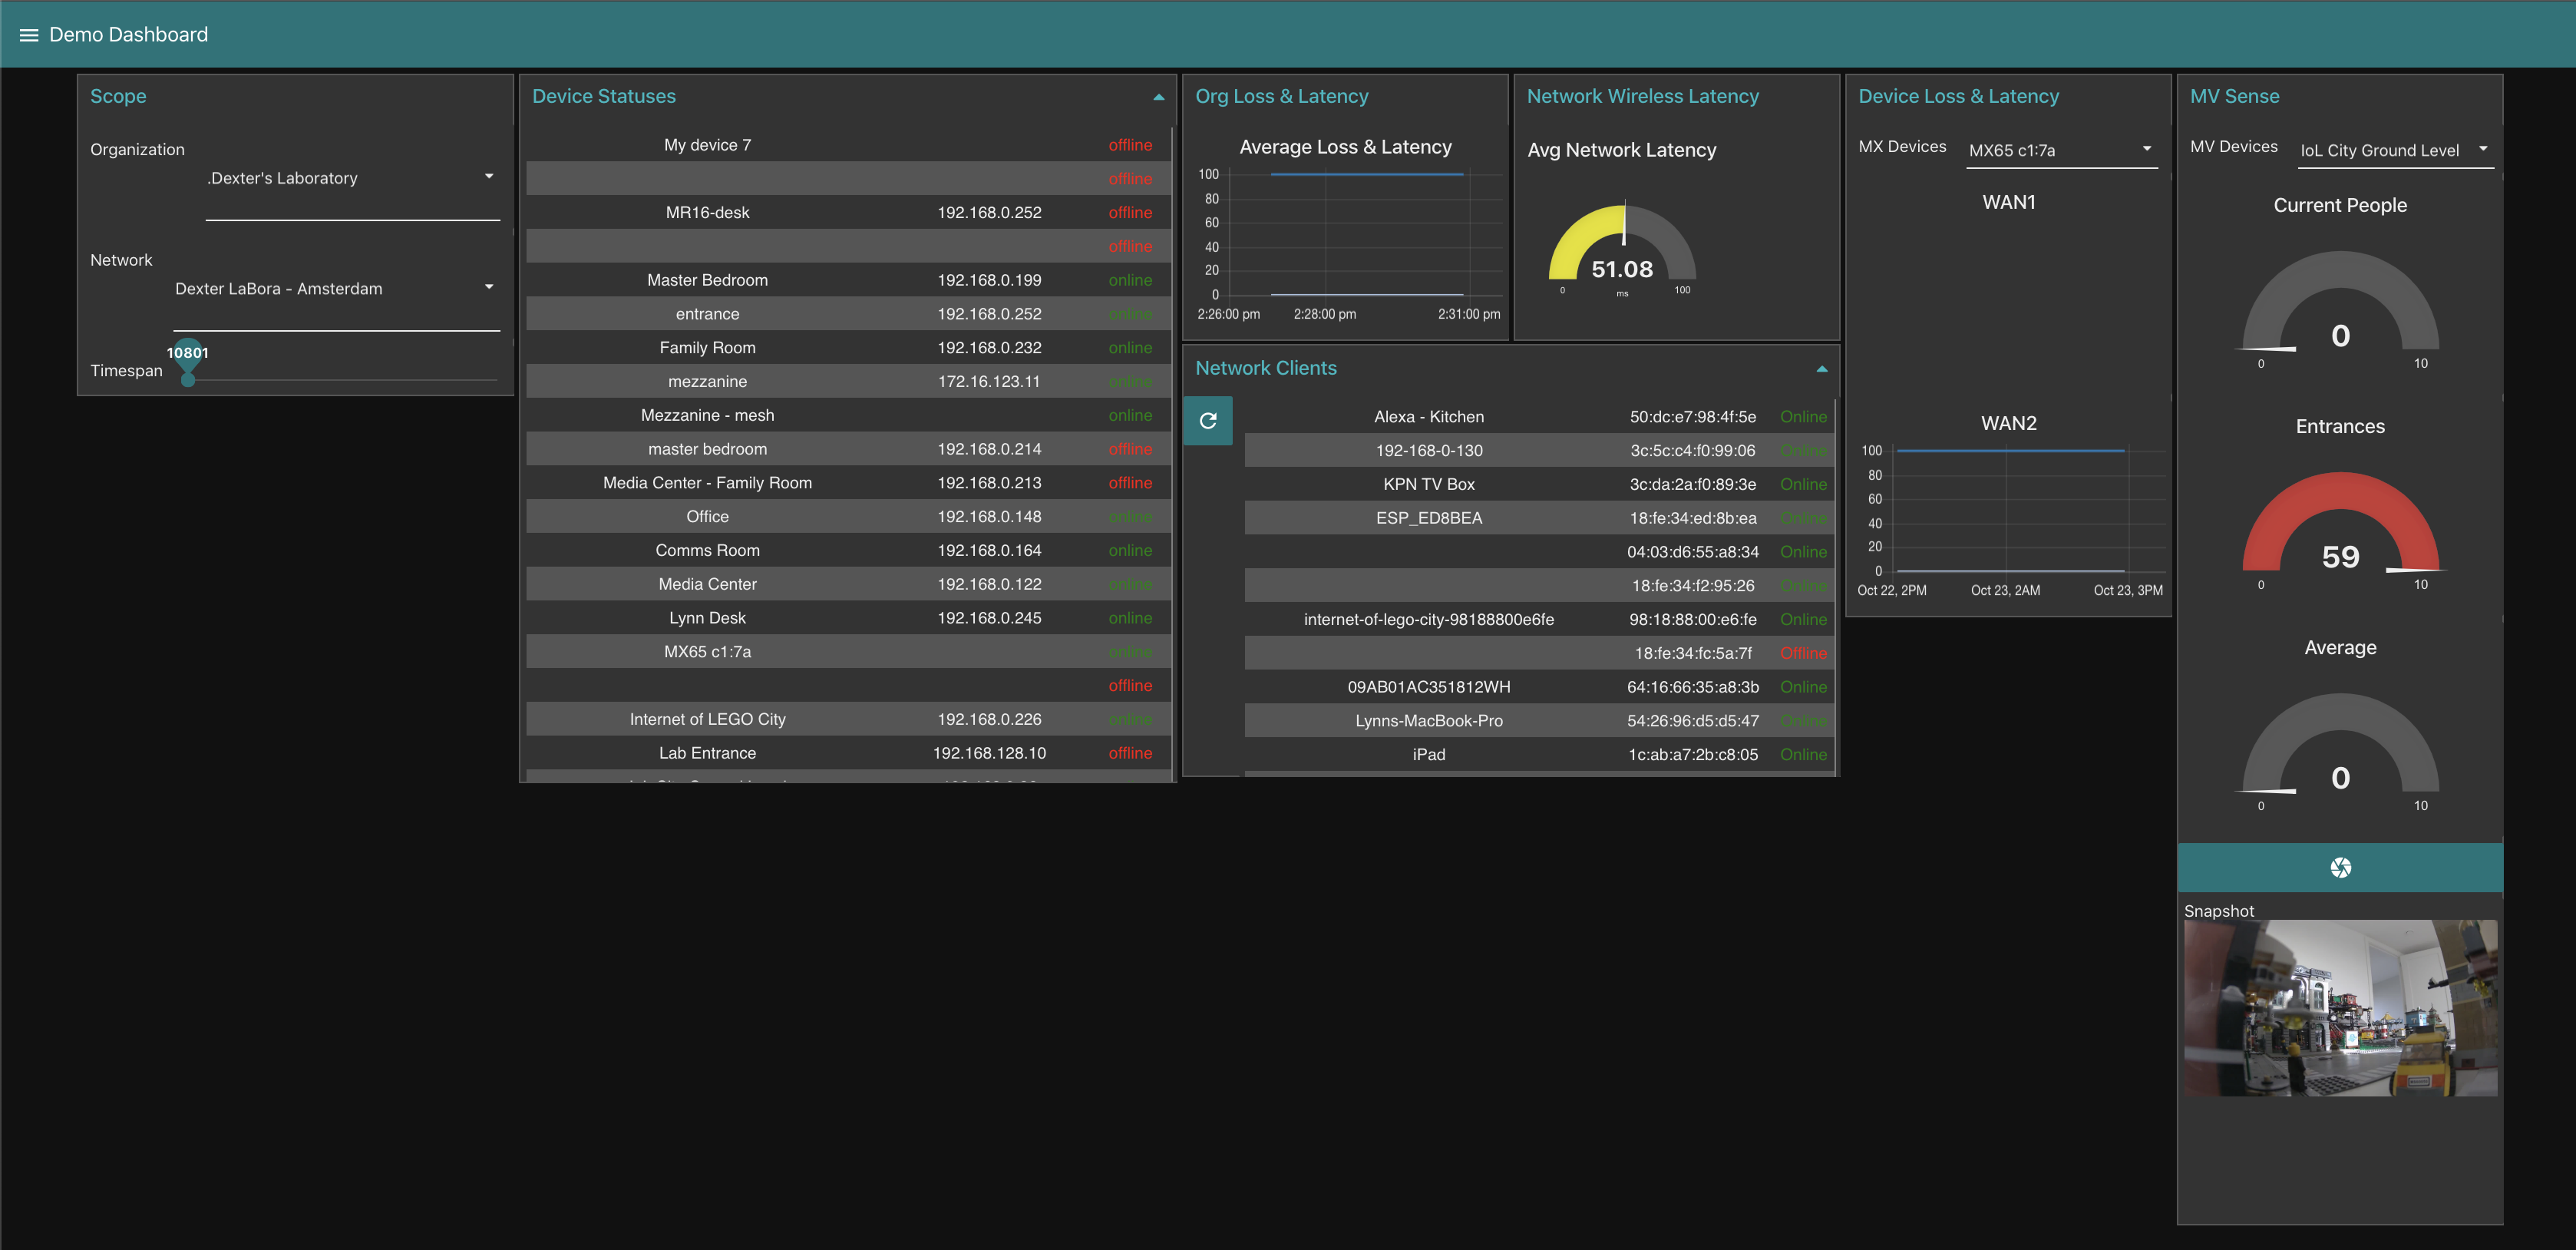
The Node-RED Dashboard is collection of nodes that allow you to create web dashboard that directly interacts with your flow. By using the various nodes, you can replace inject nodes with buttons and instead of printing to the debug you can now send the data directly to a web component such as a gauge or table.
Disclaimer
This node creates a single-user interface, unlike a classic multi-user web page. This means, any changes made to the dashboard are immediately mirrored to any other user viewing it.
The node is based off of the original AngularJS framework, and has some known performance issues.
Alternatively, you could build a classic HTML page and use Node-RED as the backend service.
Pre-requisites
To begin creating a dashboard, there are a few extra nodes that need to be installed. You can search and install from the palette manager or via the command line with npm install ...
node-red-dashboard
node-red-node-base64
node-red-node-random
node-red-node-ui-table
node-red-contrib-ui-media
Getting Started
Once the Node-RED Dashboard and supporting nodes have been installed, you can access the Dashboard by navigating to your Node-RED instance followed by /ui
Text

The text node provides the ability to display a single value on the Dashboard.
This flow expects the following response from the Meraki API node, and then assigns specific body properties to each of the text nodes.

Meraki JSON response
[
  {
    "status": "OK",
    "expirationDate": "May 4, 2023 UTC",
    "licensedDeviceCounts": {
      "MS": 100
    }
  }
]
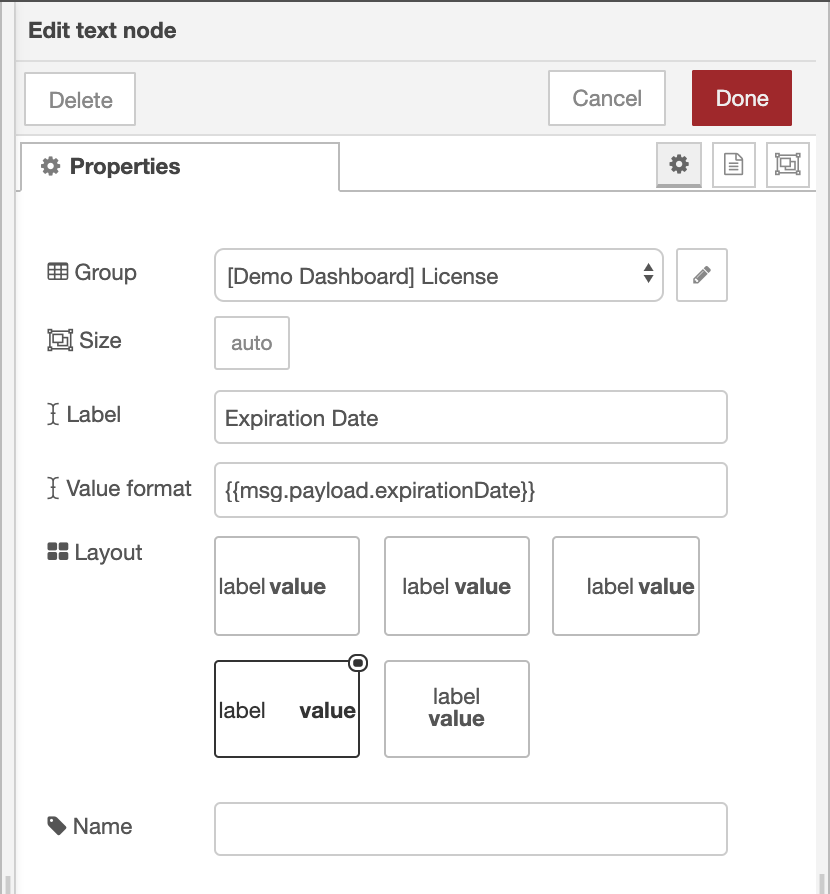
Edit the text node, specifying the Value format property
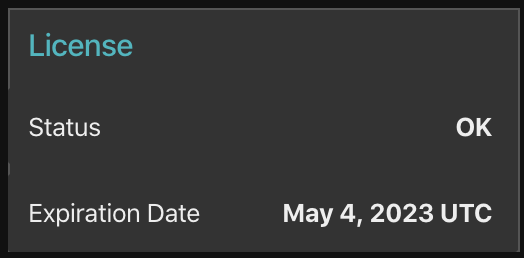
The Dashboard will now display your information.
Buttons

Use a button to trigger a flow. By double clicking on the button node, several options can be defined such as the icon, label as well as the data to be sent, such as the msg.payload and msg.topic values.
This flow creates a button to reboot a specific Meraki device.


Selectors

The dropdown selector can be used with a list of items.
To format the data properly for this node, a function node first loops through each of the items and sets the option names and values.

// set options

var options = [];

// loop through each item and add to options
msg.payload.forEach(d => {
    var obj = {};
    obj[d.name] = d.id;
    options.push(obj)
})
// set default option to first item
msg.payload = msg.payload[0].id;
msg.options = options;
return msg;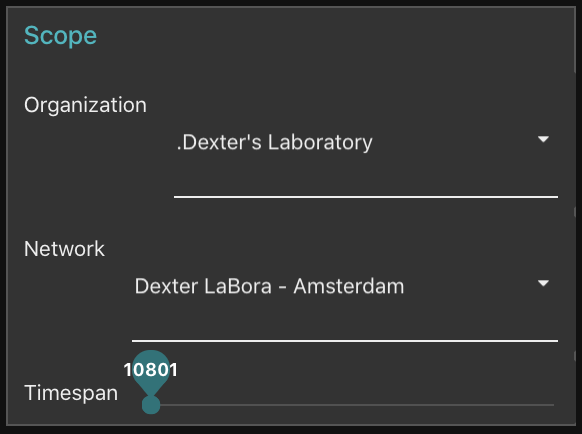
Gauges

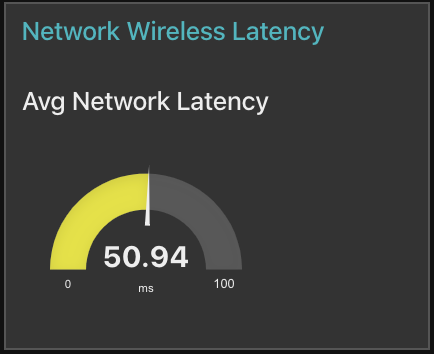
A gauge is handy when you have a single value that changes over time.
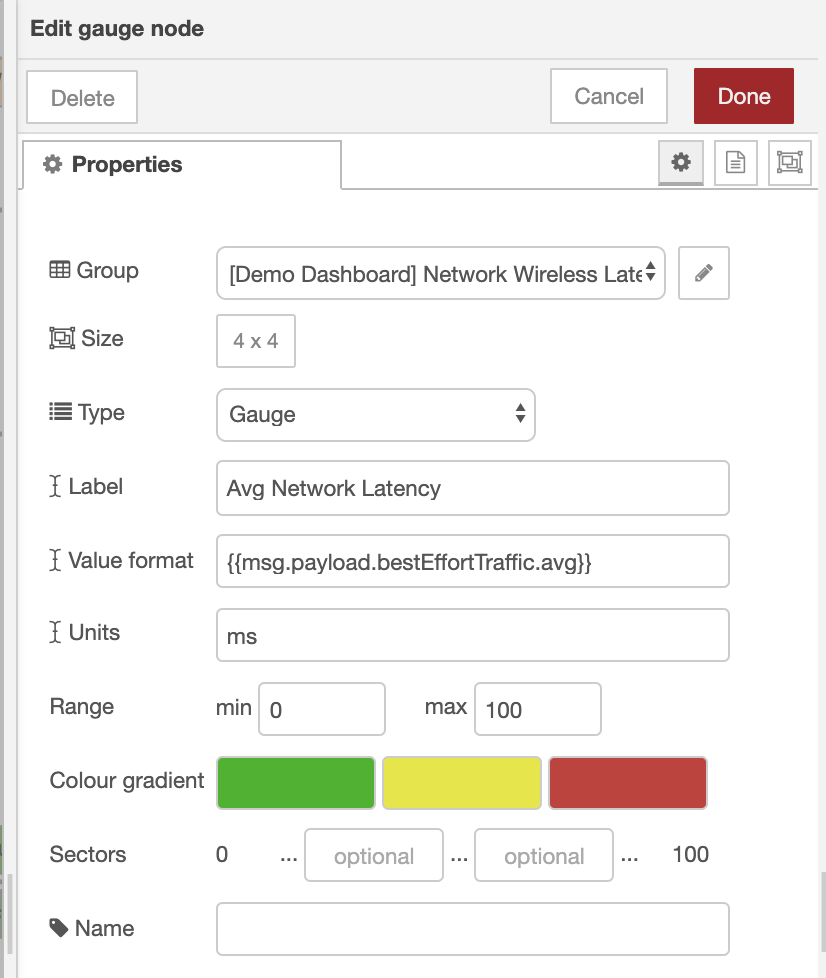
This flow uses the wireless latency stats provided by the Meraki node. Edit the gauge, by setting the Value format field to the msg.payload property you are interested in. The example uses the parameter {{msg.payload.bestEfforTraffic.avg}} to display the average traffic.

Charts
Charts are useful for displaying event series data.
There are several ways to configure these. Read the official docs here.
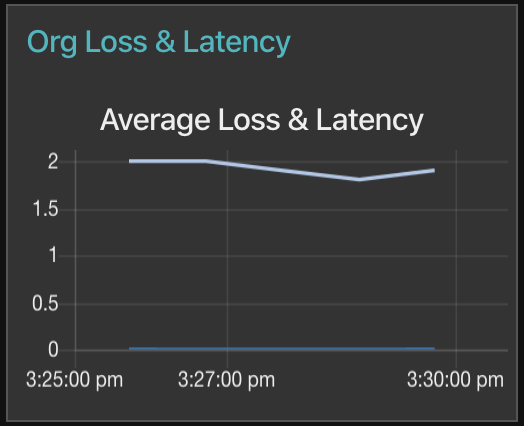
This flow displays the timeSeries array values from the Meraki Organization's Loss & Latency response.

The function iterates through the series array and creates data arrays for the loss and latency values.
format data function
var series = msg.payload.timeSeries;
var label = msg.payload.serial

var loss = [];
series.forEach(s => {
    loss.push({"x":s.ts, "y":s.lossPercent})
})

var latency = [];
series.forEach(s => {
    latency.push({"x":s.ts, "y":s.latencyMs})
})

msg.payload = [{
"series": ["loss", "latency"],
"data": [
    loss,
    latency
],
"labels": [label]
}]
msg.topic = msg.payload.uplink;
return msg;
Form

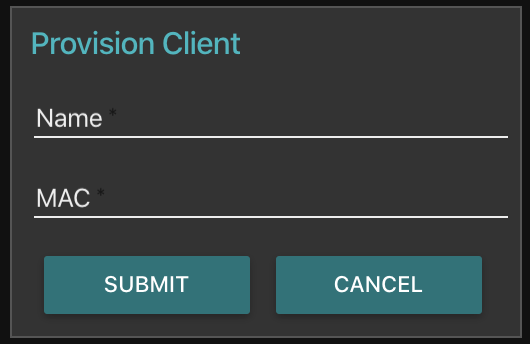
The form nodes offers the ability to create a simple static collection of inputs.
This flow defines the form inputs, then applies additional parameters before calling the Meraki API to provision a client.

Edit the form node with the msg properties and labels.
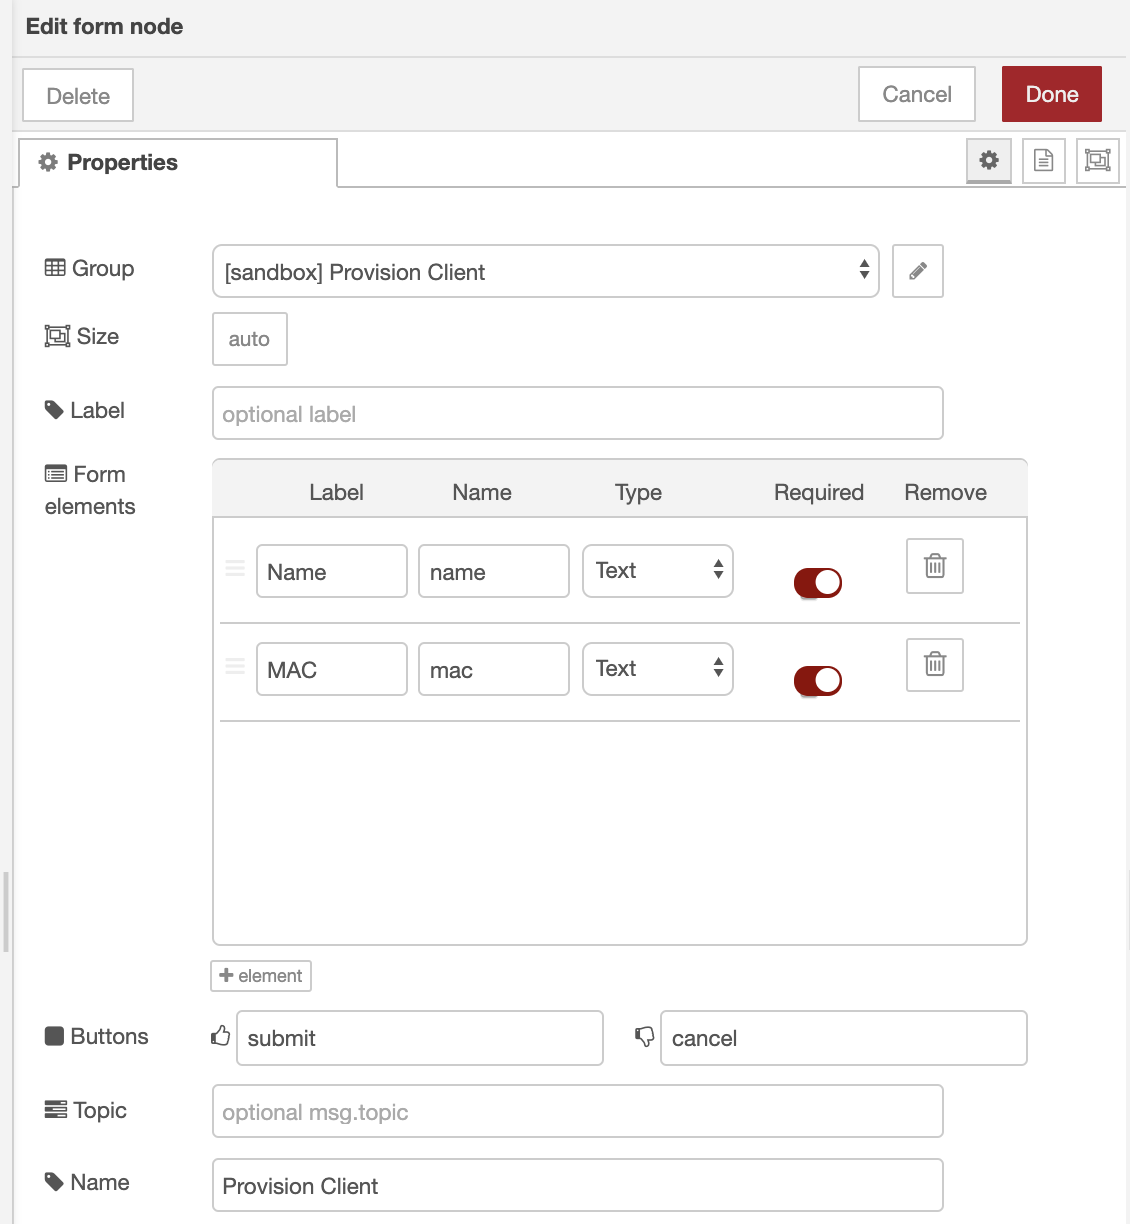
Form Example
Tables

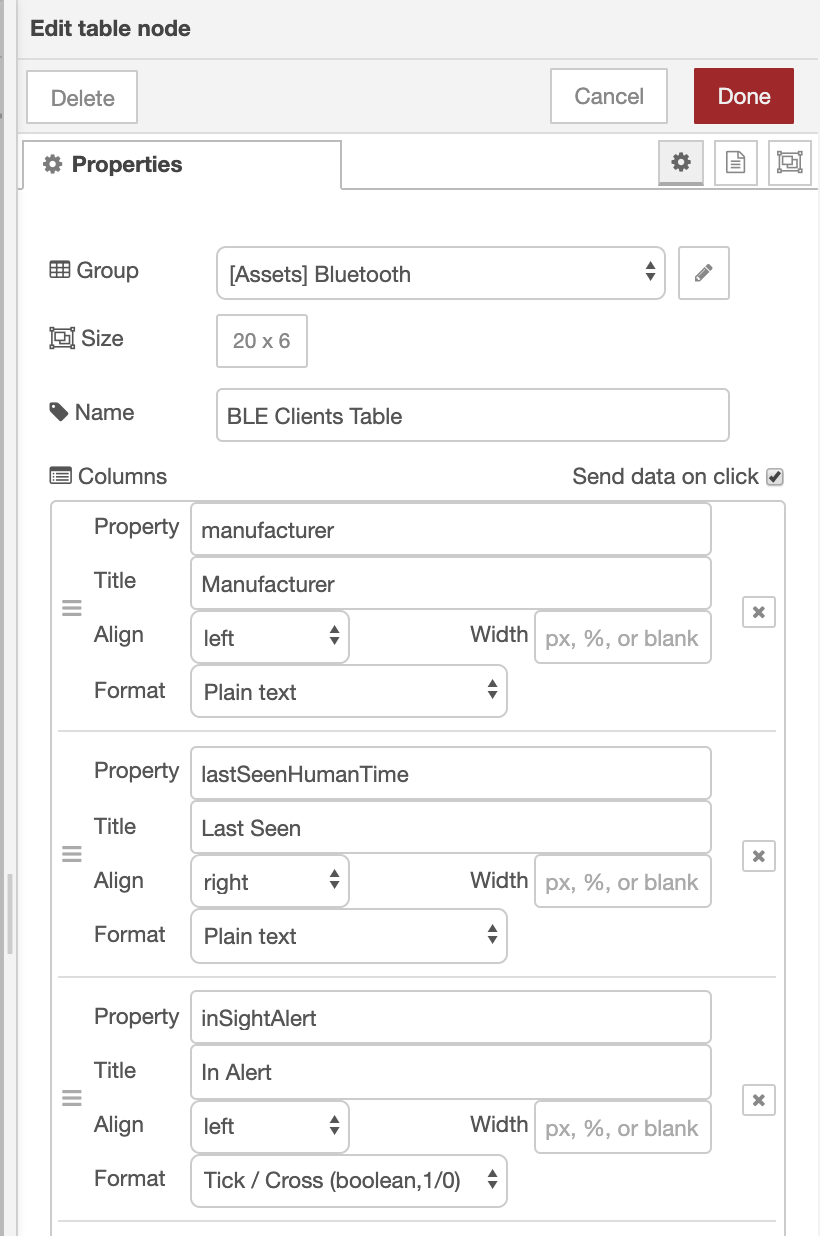
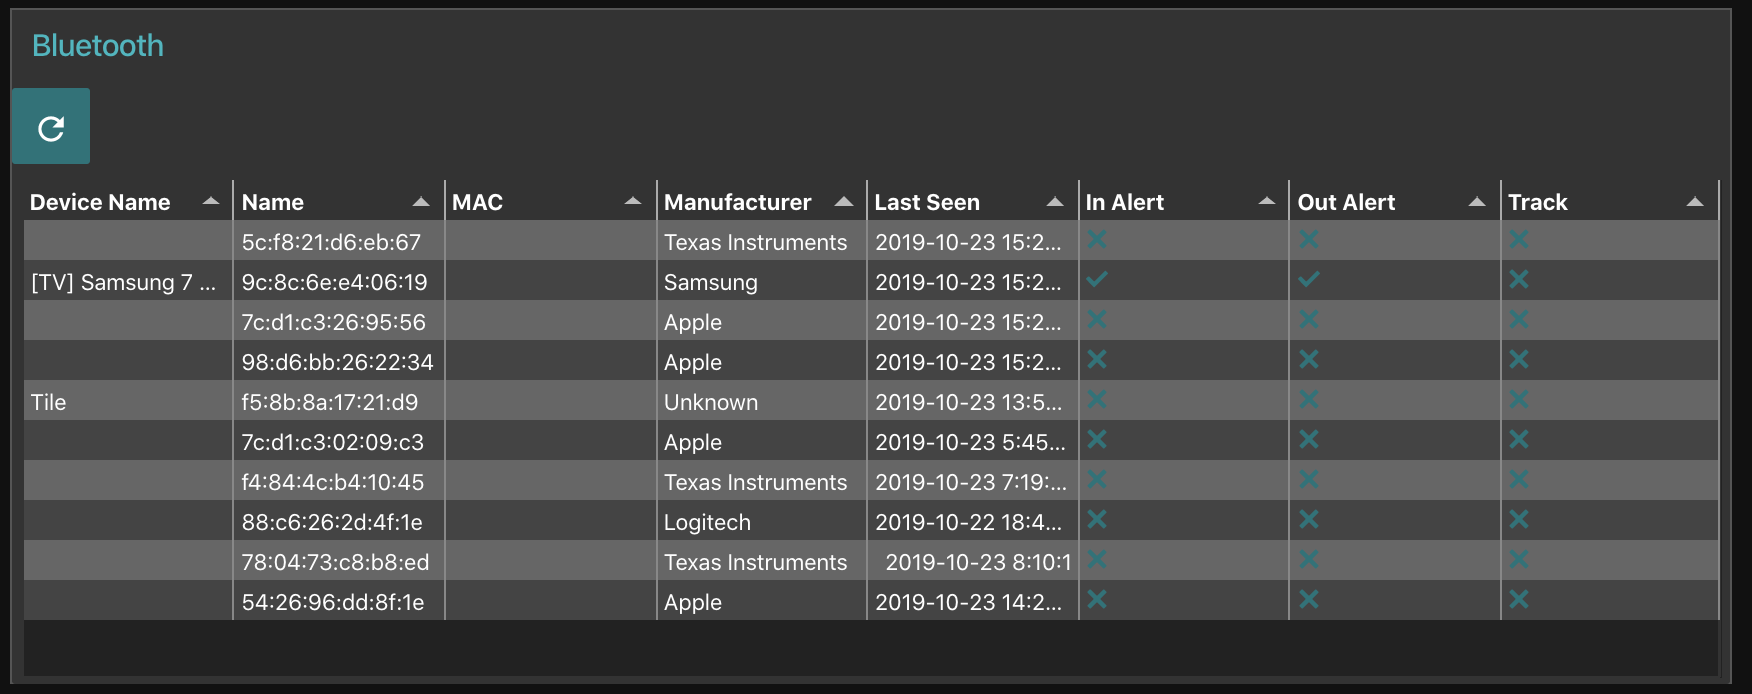
Use the table node to display arrays of data.
This flow creates a dashboard with a refresh button and clients table. It also appends some AP info into the results for more context.

Editing the table node allows you to map the columns to the desired response properties.
Templates

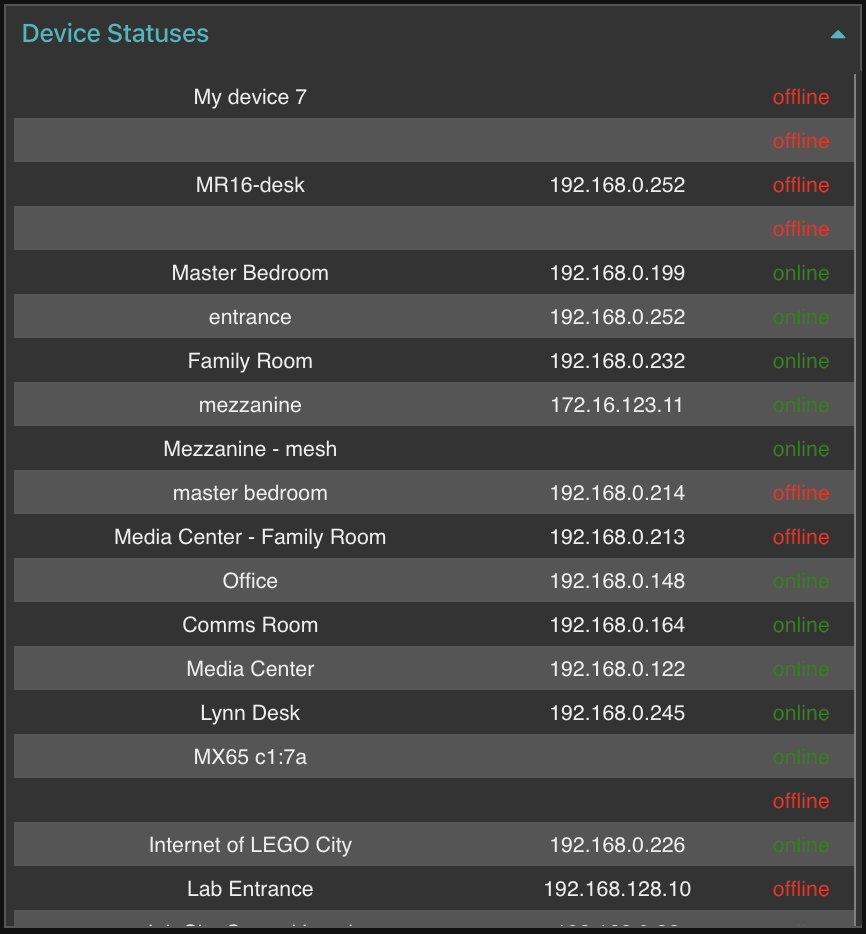
Templates are a flexible way to create your own component. Some basic knowledge of HTML and AngularJS is needed to utilize this node.
This flow calls the Meraki API to get the status of every network device. It then uses a template node to dynamically render a table using AngularJS.

edit template node
<style>
    {{msg.style}}
</style>

<table>
  <tr ng-repeat="obj in msg.payload">
    <td>{{ obj.name }}</td>
    <!-- <td>{{ obj.serial }}</td> -->
    <td>{{ obj.lanIp }}</td>
    <td ng-style="obj.status ==='online' ? {'color':'green'} : {'color': 'red'}">
        {{ obj.status }}
    </td>
  </tr>
</table>
