Pipeline to automatically retrieve traces from the new Cisco 9800 Wireless controller and display various info on a Kibana dashboard.
Download
Overview
One of the important serviceability aspects on the new c9800 wireless controller is the support for 'always on' traces. The always-on traces allow to investigate behaviour that happened on the past, even when no special debug was enabled.
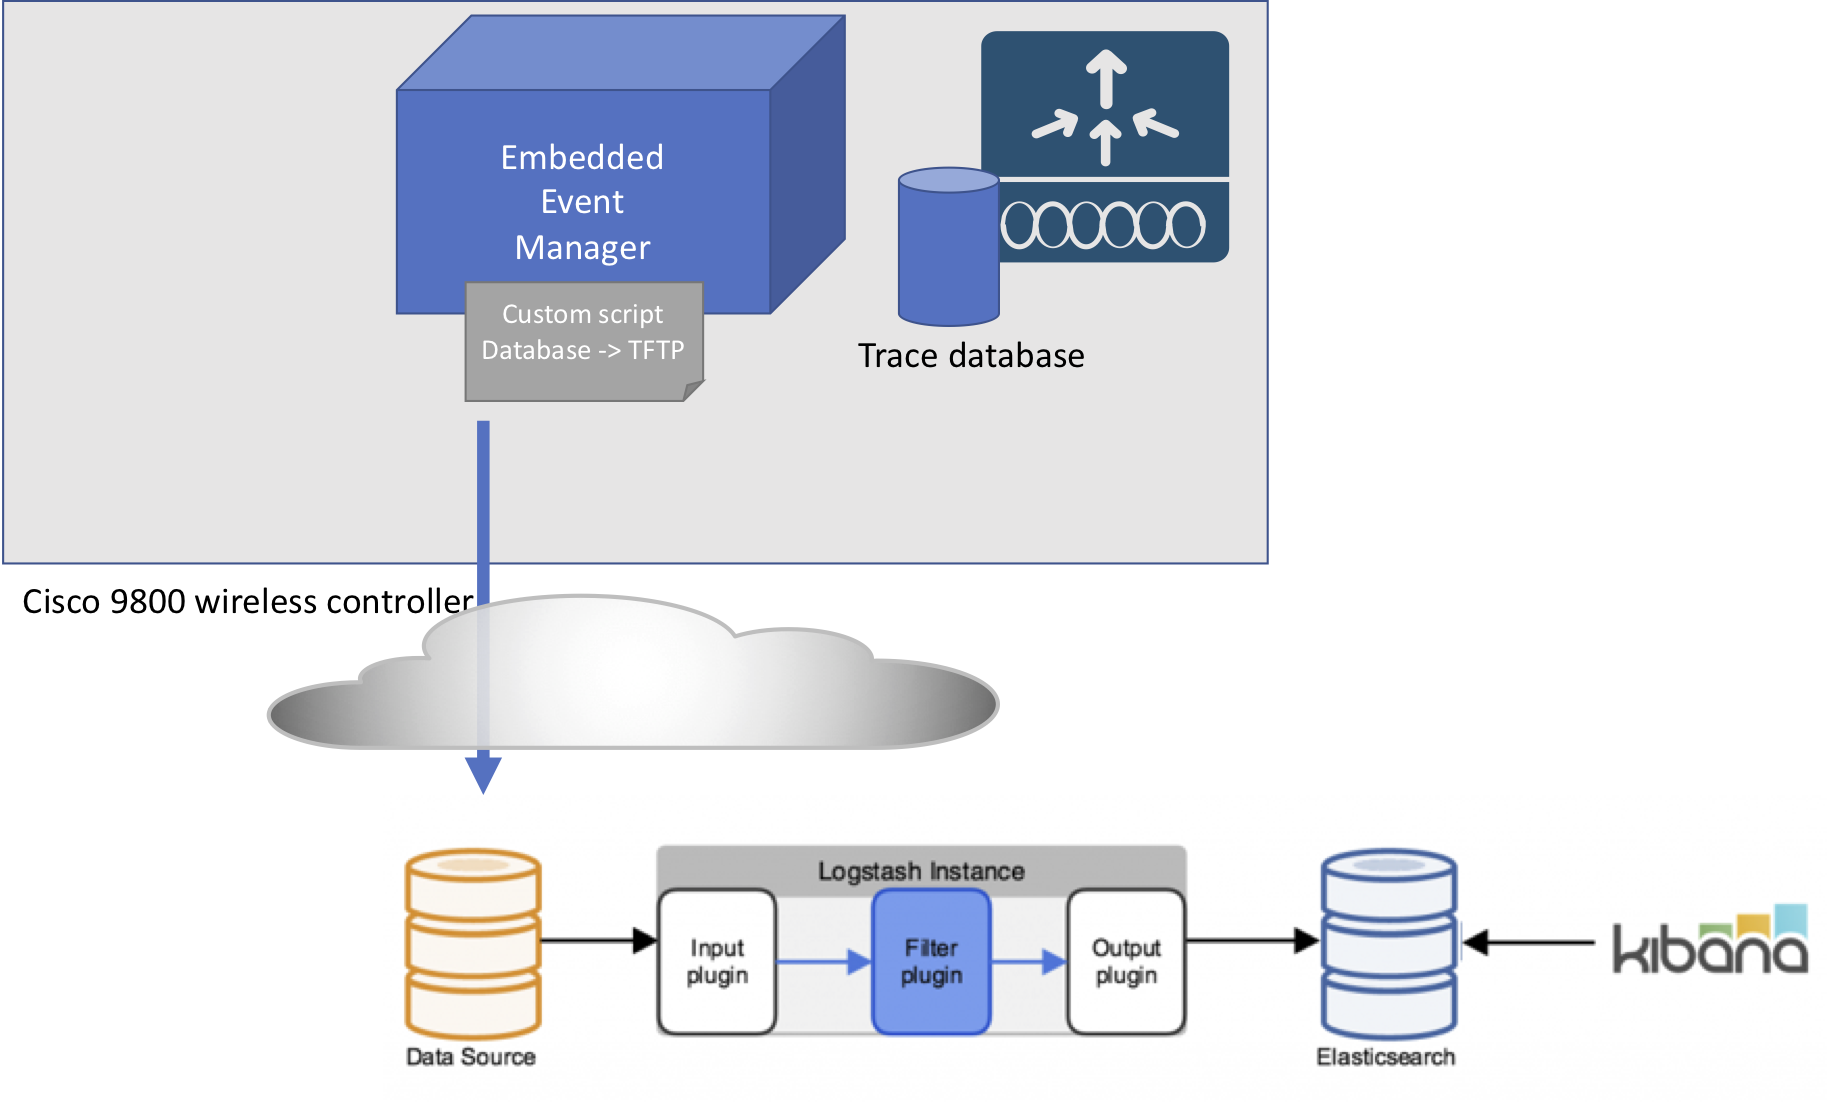
As an example of this rich data, this demo periodically export the latest traces from the controller and sends them to a ELK (Elasticsearch, Logstash, Kibana) stack.

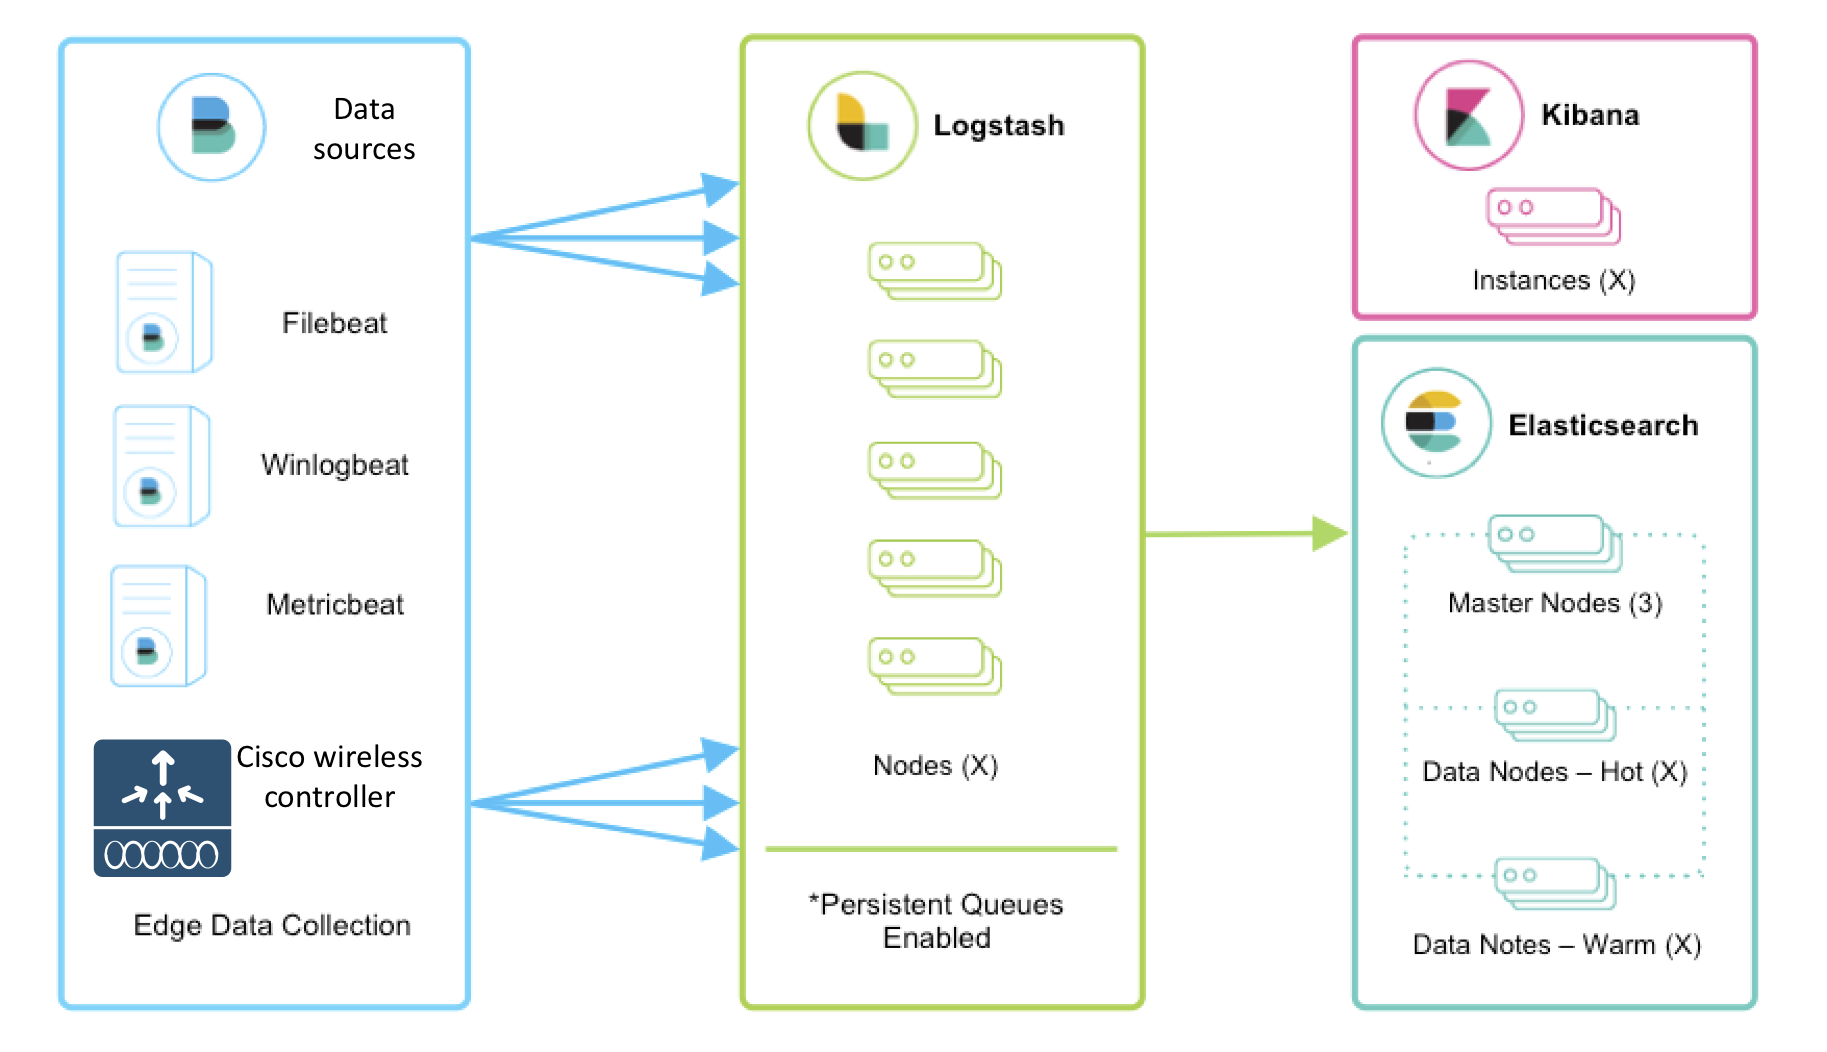
ELK stack is a widely used setup comprised of three open source projects. They provide a scalable way to ingest, store and process huge amounts of live logging data.
- Logstash Logstash task is to receive events and logs from different data sources, and insert them into a document database (Elasticsearch)
- Elasticsearch Elasticsearch is a document database optimized for fast searches and huge amounts of data
- Kibana Kibana is a graphical frontend for Elasticsearch, providing a rich set of graph generations.
Typical ELK flow can be seen on this diagram:

Ingesting the controller traces
Cisco Wireless controller provides a huge set of always-on traces, which allows to monitor every aspect of the controller. The controller exports thousands of different trace messages, covering AP state machines, client state machines, memory allocation, internal database management, messages being sent/received, etc.
Out of those thousands of messages, for the purpose of this demo we're interested in only 4 of them, which will cover client state machine changes.
By storing and analyzing client state machine changes, we can display several interesting graphs:
- Historical data of AP / client associaton
- Most used APs by period of time
- State changes on the client
Scripting tasks on Cisco 9800 wireless controller
The periodic trace export is done using several techniques available in IOS-XE:
- Embedded Event Manager
- TCL scripting
Embedded Event Manager
Event manager is an XE feature that allows a customer to specify actions to be performed when a given event occurs. In order to periodically export the trace, we use Embedded Event Manager to periodically trigger a TCL script.
event manager directory user policy "bootflash:/user_eem"
!! Copy collect_wireless_logs.tcl to bootflash:/user_eem directory
event manager policy collect_wireless_logs.tcl type user
event manager applet WirelessLogs
 event timer watchdog time 60 maxrun 200
 action 1.0 cli command "enable"
 action 2.0 cli command "event manager run collect_wireless_logs.tcl"
TCL scripting
Embedded Event Manager triggers this TCL script, which collects the traces since last period and uploads them to a off-box location. Collecting the traces can be a time consuming operation, but this script runs asynchronously so it has no impact on the controller operation.
Logstash plugin
Once the traces are stored in the off-box storage, Logstash processes them. The traces we're interested in are the ones relevant to the client state machine. For this type of data, the aggregation Logstash plugin is very useful.