Using WCAE GUI
How to load a file:
Currently, the application supports AireOS, 9800 and EWC IOS-XE controllers.
- For AireOS: please load "show run-config". Capturing over SSH works best
- For 9800/EWC: use "show tech wireless"
- No other file types are supported (for example, show tech, or config backup, etc)
To load a file, use either the Open file option or icon:
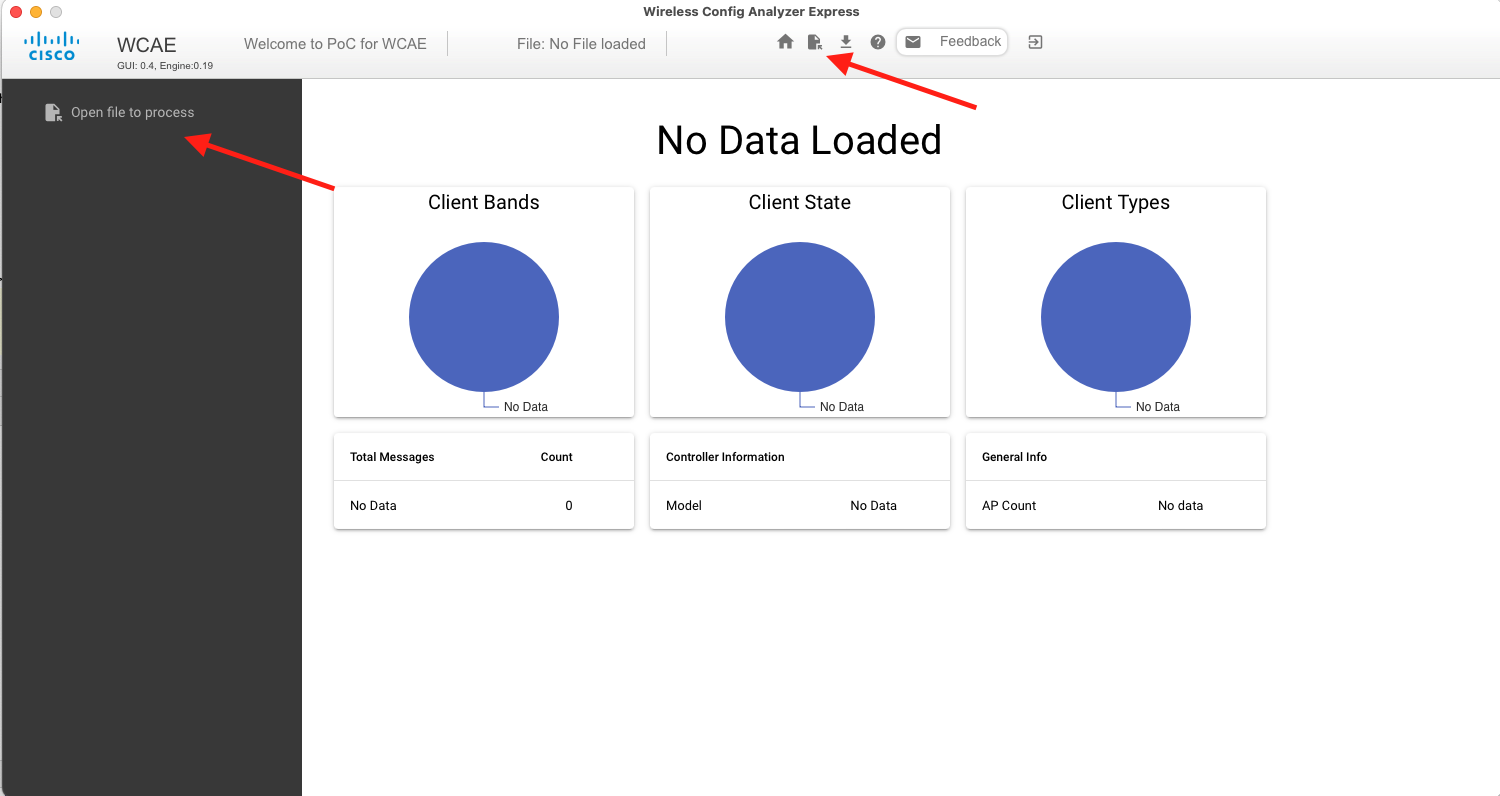
Use the open file dialog to select an appropriate file to load, it will be parsed and processed, and initial data will be displayed.
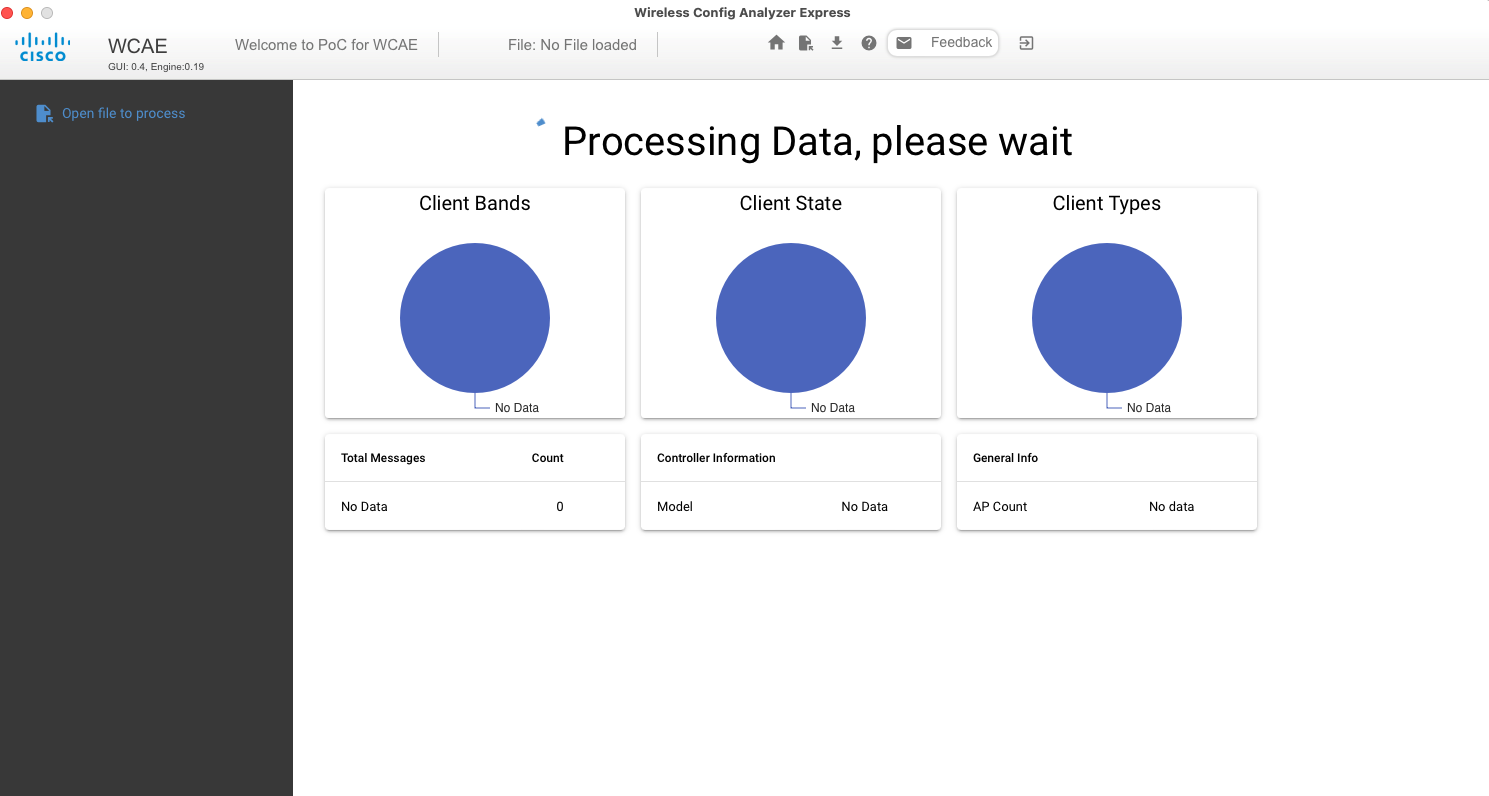
In case the file is not valid or unsupported, it will display a quick error notification.
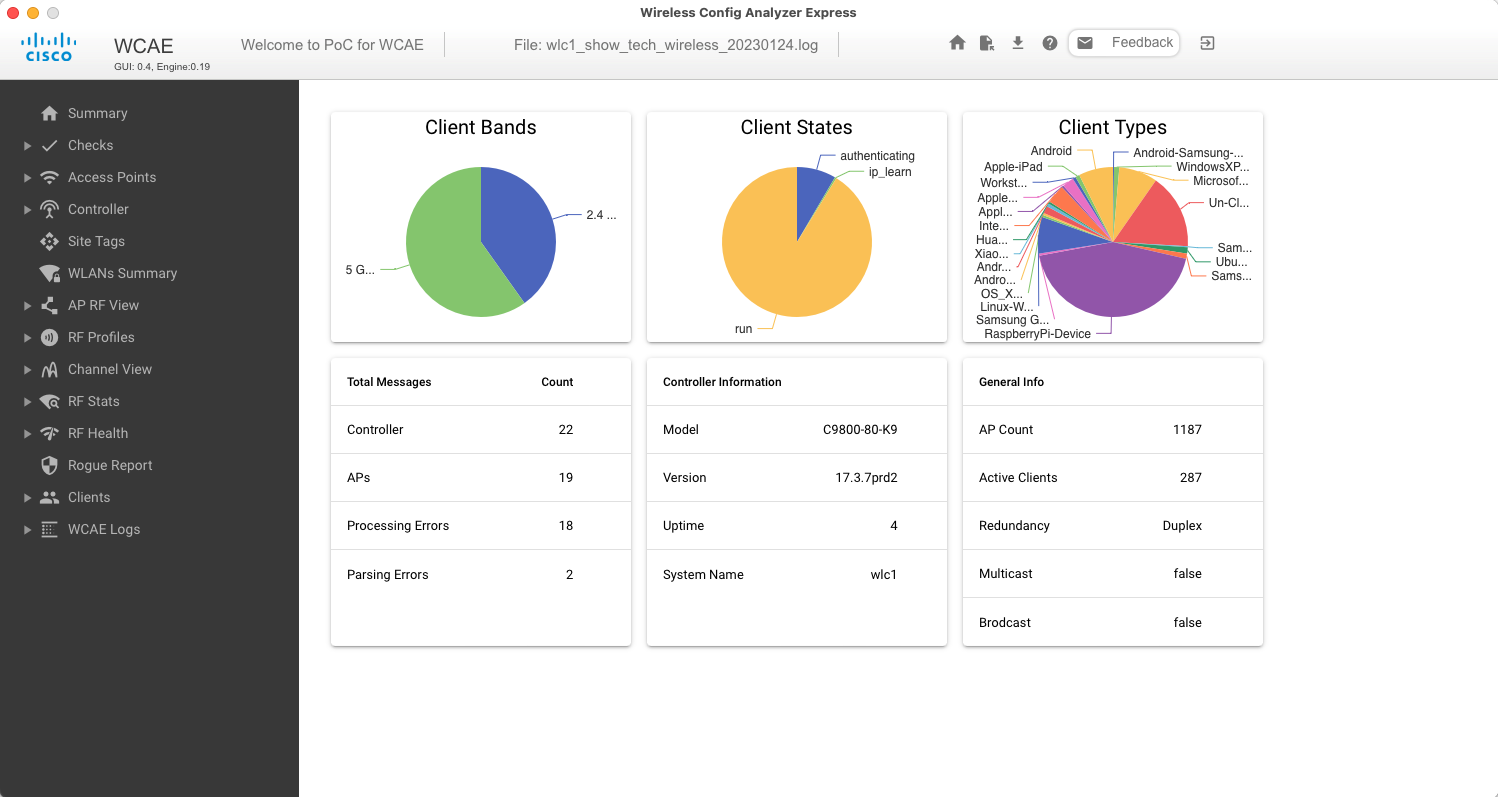
Initial data example:
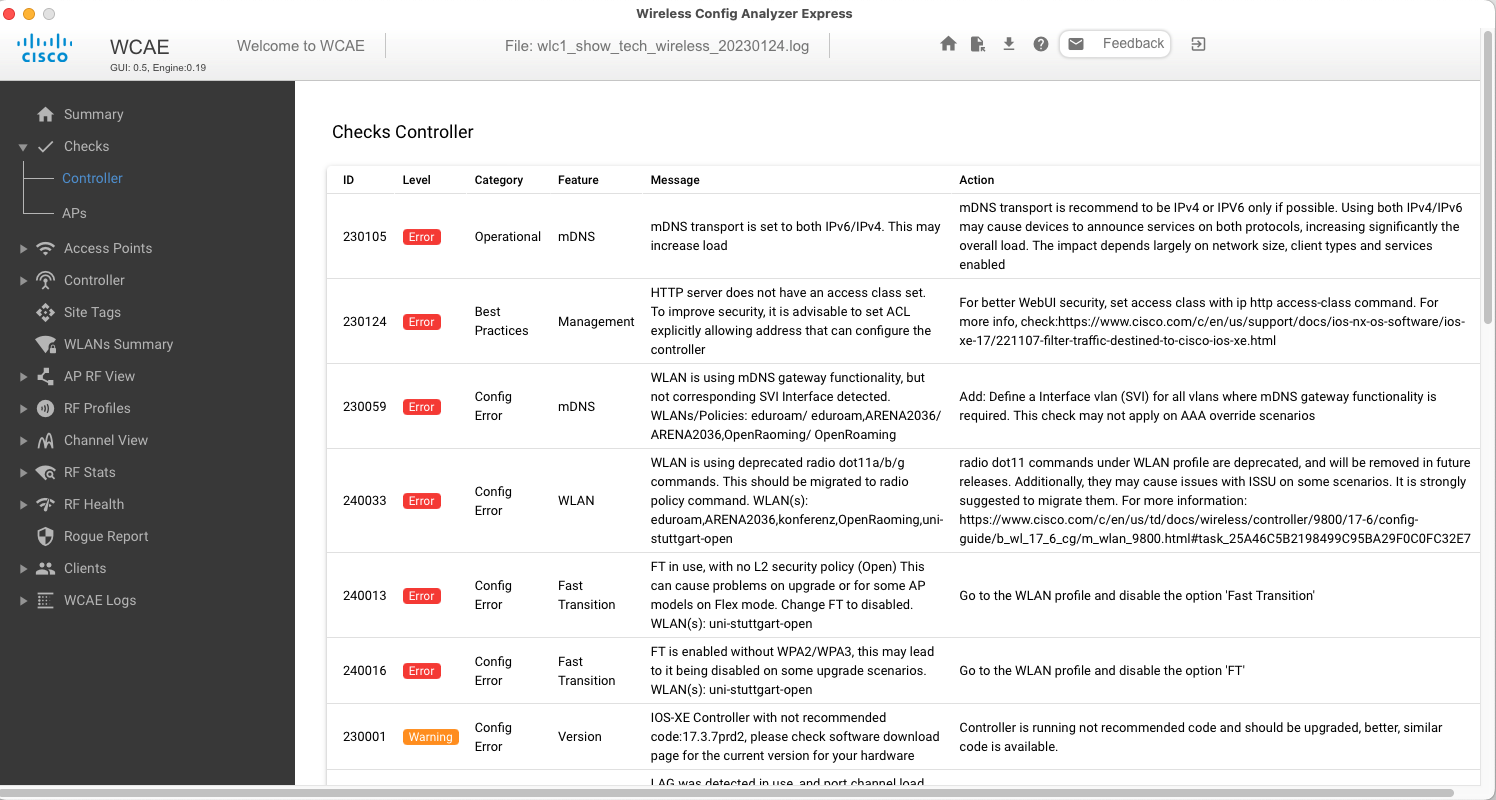
AP and Controller Checks
The new interface supports the same checks as provided by the cloud and mini-Desktop version, available in the Checks section:
Using Channel View
This is a feature intended to provide a “quick feeling” on the RF deployment quality and characteristics.
As it is common across all other views in the application, data is aggregated per Controller, Site Tag and Flex Profile, to make it easier to have a summarization per physical area
The main key things to check here are:
What is the average power level per summarization level: Getting a value close to power level 1 means this is a low density deployment, that may have lower throughput or roaming issues, as clients will have less Aps next to them. On the other hand, getting values close to 8, will indicate a very dense deployment, so it would be important to check for co-channel interference or other indications of possible channel overlap. Ideal scenarios look for power levels between 3 to 5
Site Tags in use: deployments done with “default-tag” will have a lower roaming performance, versus using different site tags per area. The impact and if this is really important or not, may vary depending on network size, client count, and key caching mechanisms
Channels in use: if a particular channel is not in use for a give area, it may indicate either RF interference or some manual configuration (for example, all Aps are on channel 6, 11). Also, high AP counts per channel, without using all the options allowed on the regulatory domain, may lead to sub-optimal networks

Detecting Client Issues
There are several application areas that can provide insights that on possible network issues, that will have impact on client performance.
Key areas will be:
RF Health Low SNR Client: Values close to zero, would indicate large counts of clients associated with SNR 15 or lower
RF Health Channel Count: lower values indicate possible high count of channel changes per day, (more than 4), that could trigger client disconnections

In AP RF Stats, the metrics of On channel Neighbor count, and Highest, Lowest Frames can provide insights on the possible “RF” view that a roaming client may have while roaming, and it they can see or not a possible suitable candidate, as well how much channel overlap each AP may have, which would cause performance issues

Version Check
The WCAE GUI will check once per execution if a new version is available on the distribution servers, to show its availability. In case there is no connectivity, the check will silently fail.
No local information is sent as part of this check, plus it will not download any file, the new version has to be manually downloaded and installed

AP RF View
This provides a different analysis perspective on the RF relationship between Aps in the network. It is based on the Neighbor Discovery Protocol, supported by all Catalyst Aps, as part of RRM functionality. Each AP radio will have other neighbors learnt through NDP, and the graph will use the NDP RSSI value as a gravity force, to cluster Aps together, based on their RF relationships
Currently, three main views are provided:
- Site Tag: AP color is assigned based on the tag configured on AP. This can be used to analyze possible inter-site roaming scenarios
- WNCD: AP color is assigned based on the WNCD/CPU where the AP is joined. Useful to analyze CPU load, and inter-wncd roaming scenarios coming from RF designs
- RF Health: AP color is assigned on a scale based on the RF Health metric per radio. It can highlight physical areas that are suffering from different client impacting issues
On all views, clicking on AP or zooming in/out can show the AP name. Additionally, you can click any AP to get more details about that radio. Clicking it again closes the detail table
Each node represents an AP radio, and the size is in direct relationship to the number of Neighbors that the radio has. This is to highlight how “impacting” is that radio in the overall RF environment
Example of university campus with inter-site tag roaming on some areas:

It is possible to filter links, to remove low RSSI values. By default, all links are displayed, and you can apply a filter at -85, matching RRM filtering mechanism.
Exporting to Excel
The application can generate the full XLSX report that is available through the mini-Desktop tool or the cloud versions. To create the file, click on the export icon available on the toolbar, and save locally:

Known limitations and issues
Support only for 9800 or EWC based controllers
AireOS controllers not supported (planned for future release)
Tool window can’t be re-sized
Pie Graphs do not support zoom or font adjustments
Sometimes when using filtering, the last table rows may get duplicated after removing the filter. This is issue on the underlying UI library
RF View calculation is not multi-threaded, so it may fail or cause UI issues for very large networks (thousands of AP radios and links)
Table views can’t be exported or copies (use the XLSX export feature instead)