KPI Dashboard
- Download
- Install Read Me
- User Documentation
- Support, Questions, Feature requests: wireless-kpi-tool@cisco.com
Installation Prerequisites
- 4 CPUs minimum
- 16G RAM minimum
- 150G HD minimum
- Ubuntu 22.04.3 LTS or newer
- Correct time and TZ configured
- apt utility updated
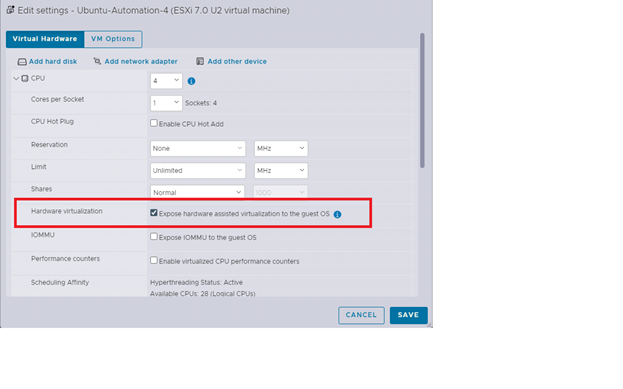
- If using a Virtual Machine (VM), only ESXi version 7.0 has been verified
- If the server is a VM, then you must check ‘Expose hardware assisted virtualization to the guest OS’ under CPU before powering on and starting installation.
Installation Steps
- Create a directory ‘container_files’ in a directory of your choosing
- Copy the kpi-tool-files.tar into the ./container_files directory
- Untar kpi-tool-files.tar
cisco@ wireless-esc-auto-5:~/container_files$ tar -xvf kpi-tool-files.tar
4. Edit the setup_config.yaml file. See section setup_config.yaml_readme in this document for an explanation of the different fields. Note: remove any unused ‘wlc’ entries
5. Run installer.sh
cisco@ wireless-esc-auto-5:~/container_files$ ./install.sh
6. Following instructions as they appear:
- You may be prompted to provide the password of the user logged in (for sudo access)
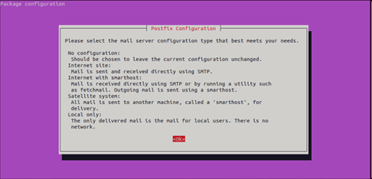
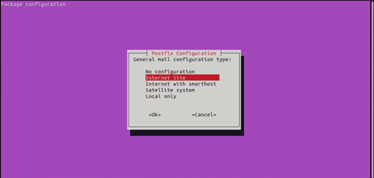
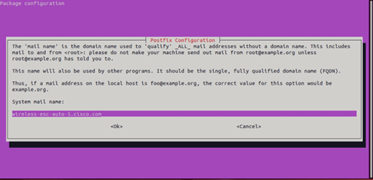
- During postfix installation you will be presented with two (possible three) semi-GUI screens. (Note: Figure 4 may or may not appear before the two prompts). Figure 5 shows the selection (Internet Site) to choose while Figure 6 shows that the FQDN of the server is auto-populated. If for some reason it is not, using this figure as an example for what to supply based on the server hostname and domain.
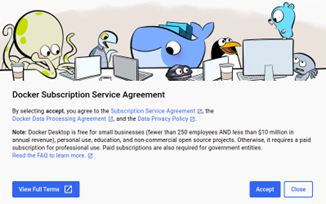
 - The final step of the installation script will be to start Docker Desktop. The script will start the Desktop and then will immediately end. Instructions for what to do after Docker Desktop is up will be displayed. You will need to wait for the first GUI splash screen to appear (see Figure 1 below). You will need to respond to the splash screen and two others before the Desktop will continue. Figures 1-3 below are screen shots of all three screens. Please use the following selections for each:
- Splash screen should be ‘Accept the license agreement’ (Figure 1)
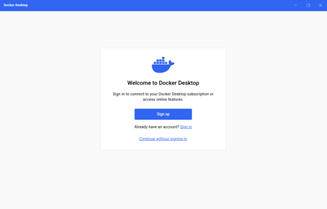
- Second screen should be ‘Continue without signing in’ (Figure 2)
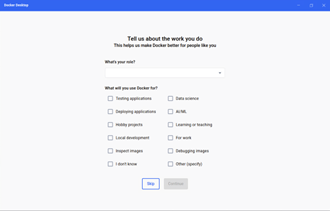
- Third screen should be ‘Skip’ (Figure 3)
- The final step of the installation script will be to start Docker Desktop. The script will start the Desktop and then will immediately end. Instructions for what to do after Docker Desktop is up will be displayed. You will need to wait for the first GUI splash screen to appear (see Figure 1 below). You will need to respond to the splash screen and two others before the Desktop will continue. Figures 1-3 below are screen shots of all three screens. Please use the following selections for each:
- Splash screen should be ‘Accept the license agreement’ (Figure 1)
- Second screen should be ‘Continue without signing in’ (Figure 2)
- Third screen should be ‘Skip’ (Figure 3)
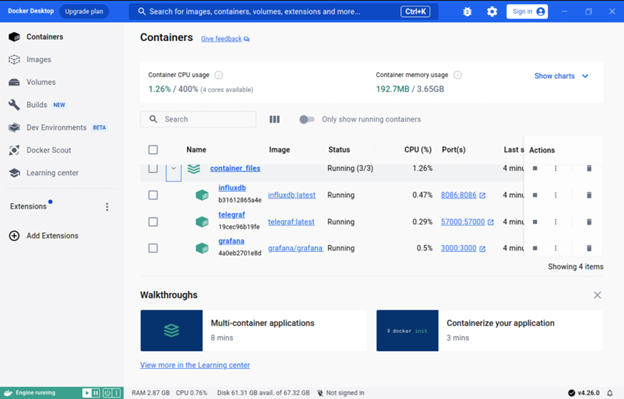
 7. Do not proceed until after Docker Desktop is fully up and running. Figure 7 below shows what Docker Desktop will look like when it’s fully up and running.
- The first notice will be to add the logged in user to the kvm group and then to start the Container once Docker Desktop is fully up and running
7. Do not proceed until after Docker Desktop is fully up and running. Figure 7 below shows what Docker Desktop will look like when it’s fully up and running.
- The first notice will be to add the logged in user to the kvm group and then to start the Container once Docker Desktop is fully up and running
cisco@ wireless-esc-auto-5:~/container_files$ sudo  adduser $USER kvm
cisco@ wireless-esc-auto-5:~/container_files$ docker compose up

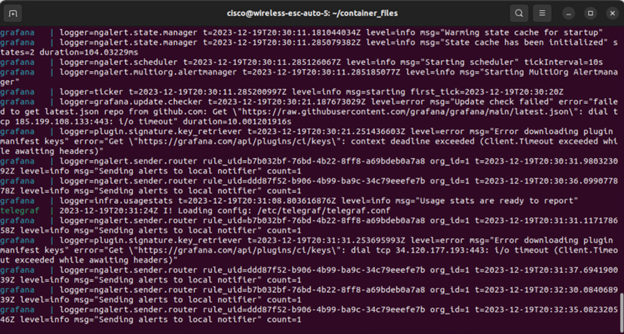
- Once the Docker Container is started (Note: it will take several minutes to download, install, configure and start) you can proceed with the second notice. Figures 8 and 9 below show what the terminal screen and Docker Desktop GUI (respectively) will look like when the Container is up:
- In a new terminal window, start the SSH2Influx scripts
cisco@ wireless-esc-auto-5:~/container_files/SSH2Influx$ python3 SSH2Influx.py -p wncd-collector.yaml -f 15
cisco@ wireless-esc-auto-5:~/container_files/SSH2Influx$ python3 SSH2Influx.py -p ap-collector.yaml -f 60
 9. Use the telemetry txt files found under ./container_files to copy/paste into the configuration for each WLC that will be monitored. See the section setup_telemetry_readme in this document for instructions.
10. Update Grafana alert email address. See section grafana_email_alert_readme for instructions.
11. The KPI Tool is now fully installed and configured. To see the graphs, do the following:
9. Use the telemetry txt files found under ./container_files to copy/paste into the configuration for each WLC that will be monitored. See the section setup_telemetry_readme in this document for instructions.
10. Update Grafana alert email address. See section grafana_email_alert_readme for instructions.
11. The KPI Tool is now fully installed and configured. To see the graphs, do the following:
- Connect to Grafana using a browser (see Figure 10 below for login screen) http://
:3000 
- Default credentials are admin/Cisco123 (see section grafana_email_alert_readme for instructions on how to change)
- Go to the hamburger menu at the top left, select Dashboards and then click on KPI Dashboard
Modify setup_config.yaml
These are the relevant fields to update to configure the KPI Dashboard to your environment:

SSH2Influx: adding more WLCs and generating encrypted credentials
If in the future another WLC is to be monitored, the following steps must be taken:
- Stop the ‘SSH2Influx’ script that was started under step 8 of the installation steps above, by using CTRL-BREAK/CTRL-C
- Use crypto.py under ./container_files/SSH2Influx to generate a new pair of username/password encrypted credentials
- Run the script
cisco@ wireless-esc-auto-5:~/container_files/SSH2Influx$ python3 crypto.py
- Press ‘Enter’ when asked if the existing key file should be used
- Supply the username and press ‘Enter’
- Supply the password (input will be masked) and press ‘Enter’
- Copy the encrypted username and password that are displayed
3. Edit the optionsconfig.yaml file in the ./container_files/SSH2Influx directory
4. Add a new entry under the section ‘device_inventory:’, following the same format and indentation as the existing WLCs
5. 5. For username and password, paste the encrypted values from step 2 above
6. Save the file
7. Edit the wncd-collector.yaml under ./container_files/SSH2Influx
8. Add a new entry under the second ‘hosts:’, following the same format and indentation as the existing WLCs
9. Save the file
10. Follow step 8 in the installation steps above to start the scripts again
11. Follow the instructions in the section setup_telemetry_readme to add the telemetry statements to the new WLC
- Note: There will not be a telemetry_
Setup Telemetry on WLC
Each WLC alias entered in the setup_config.yaml under step 4 of the installation steps above will have a corresponding telemetry_
- Start a CLI session (ssh, telnet or console) to the WLC
- Type ‘config t’ to enter configuration mode
- Copy all lines from the corresponding telemetry_
.txt file, and paste into WLC - Type ‘end’ to exist configuration mode
- Type ‘write’ to save the changes
Repeat the steps for updating the next WLC
Setup Grafana email address for alerts
There are two alerts configured:
- Alert when CPU exceeds 85%
- Alert when memory drops below 21%
To update Grafana email address for alerts, do the following:
- Connect to Grafana using a browser (see Figure 10 below for login screen) http://
:3000. (Note: Default credentials are admin/Cisco123, changing user/password can be found in this section) - Go to the hamburger menu at the top left, and then select Alerting (see Figure 11 below)
- Under Alerting, select Contact points and then on the ‘pencil’ icon to the right of Dashboard Admin (see Figure 12 below)
- Edit the ‘Addresses’ field and then click Save contact point (see Figure 13 below)
To change default credentials do the following:
- Under the same hamburger menu mentioned in step 2 above, select Administration
- From the Administration menu select Users
- In this screen you can create a new user as well as edit the default user by clicking on it in the list