Create a real time dashboard
Data from EFM can be visualized at multiple places:
- On-prem: DGLux or any other visualization tool that can receive data from EFM via a DSLink
- Cloud: via connecting to DCM or other cloud apps like IBM Watson, Microsoft Azure and Google Cloud.
Complete the following steps to create a real-time dashboard in DGLux that visualizes the data point(s) from EFM.
The DGLux Designer toolkit is included with EFM, but the license for the designer is an optional SKU.
The steps below will build from the average CPU utilization dataflow that was built in the previous page.
Open the dataflow.html page at https://EFMBrokerIP:8443/dataflow.html.
Open the DGLux Designer page at https://EFMBrokerIP:8443
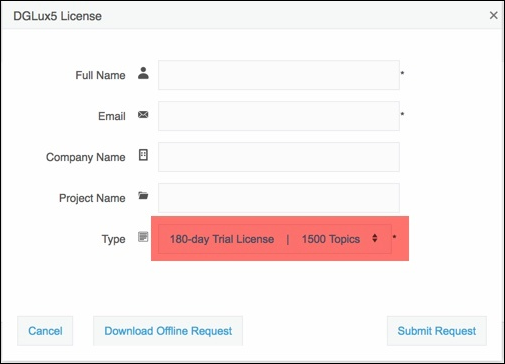
If needed, request a trial license.
You can try it out by requesting a 180 day trial license.
Select the CREATE NEW option to create a new project.
Select Blank Project (either double click on it or click Choose).
Enter the name UI_Test for this new project.

Click File > Save As.
Enter the name of the new page name Realtime_dashboard.dg5.
Click Save.

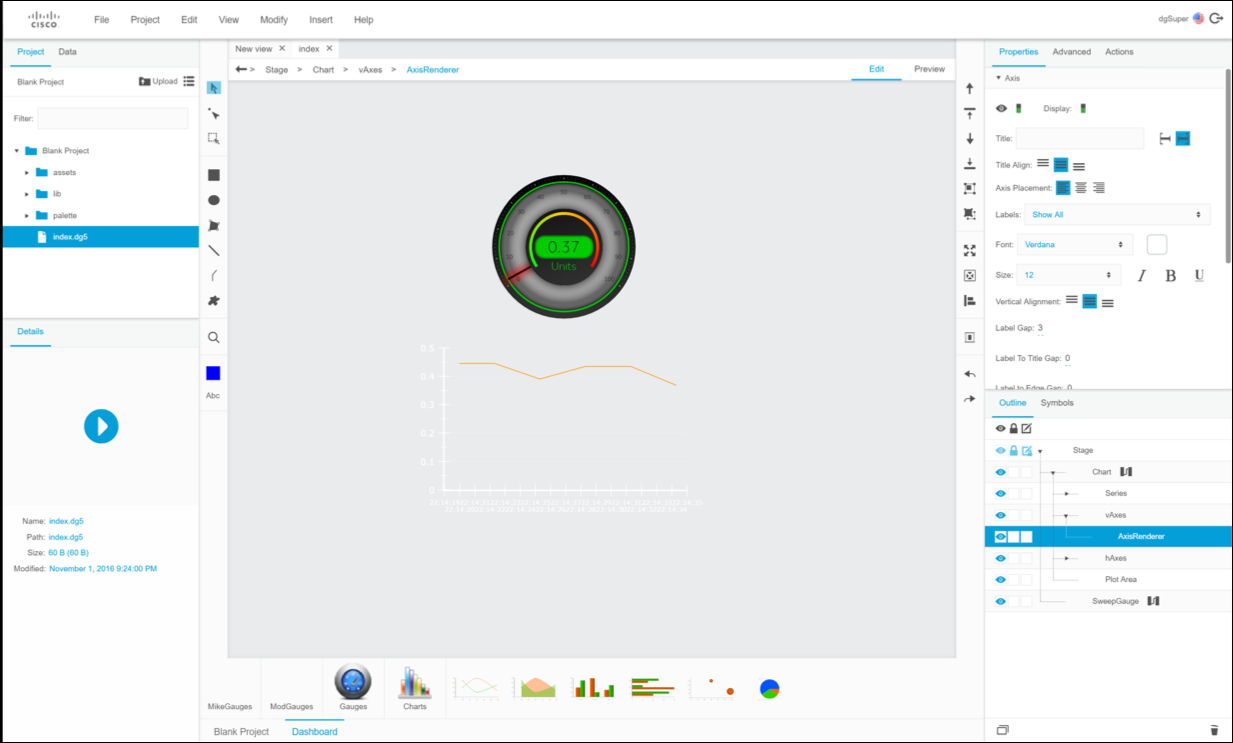
Click the Dashboard menu in the bottom panel.
Select the Gauges widgets.
Click and drag the second Gauge onto the canvas.

Select the Data tab on the top left.
Select the data node.
In the metrics tab, select CPU_Moving_Average.
Drag and drop it onto the Value property in the Properties panel on the right.
On the binding dialog, select Formatted.
Select OK.
On the Properties panel, change “precision” to 2.

Right click on the canvas and choose Insert > Charts > Chart.

In the Outline panel on the bottom right, right click Chart and select Dataflow.
Drag CPU_Moving_Average from the Metrics panel onto the dataflow canvas.

Drag a Realtime Recorder block onto the dataflow canvas.
Bind the “value” property of the “CPU_Moving_Average” block to the “value 0” property of the realtimeRecorder block.
Set the realtimeRecorder block properties to the following:
bufferSize—0
timeWindow—60
name 0—CPU Utilization

Click the table button on the “output” property of the realtimeRecorder block.
Close the dataflow.
Select the Chart component in the “outline” panel.
Drag the CPU Utilization column from the table to the graph in the canvas.

In the pop-up window, in the topmost drop down window, select Column Series and then select Line Series again.

For the y-axis, select CPU Utilization from the bottom pulldown.
Select OK.
Close the table.
Press cntrl-S to save the file.

Now you have a Gauge and Chart with data from the System DSLink.