Gateway status
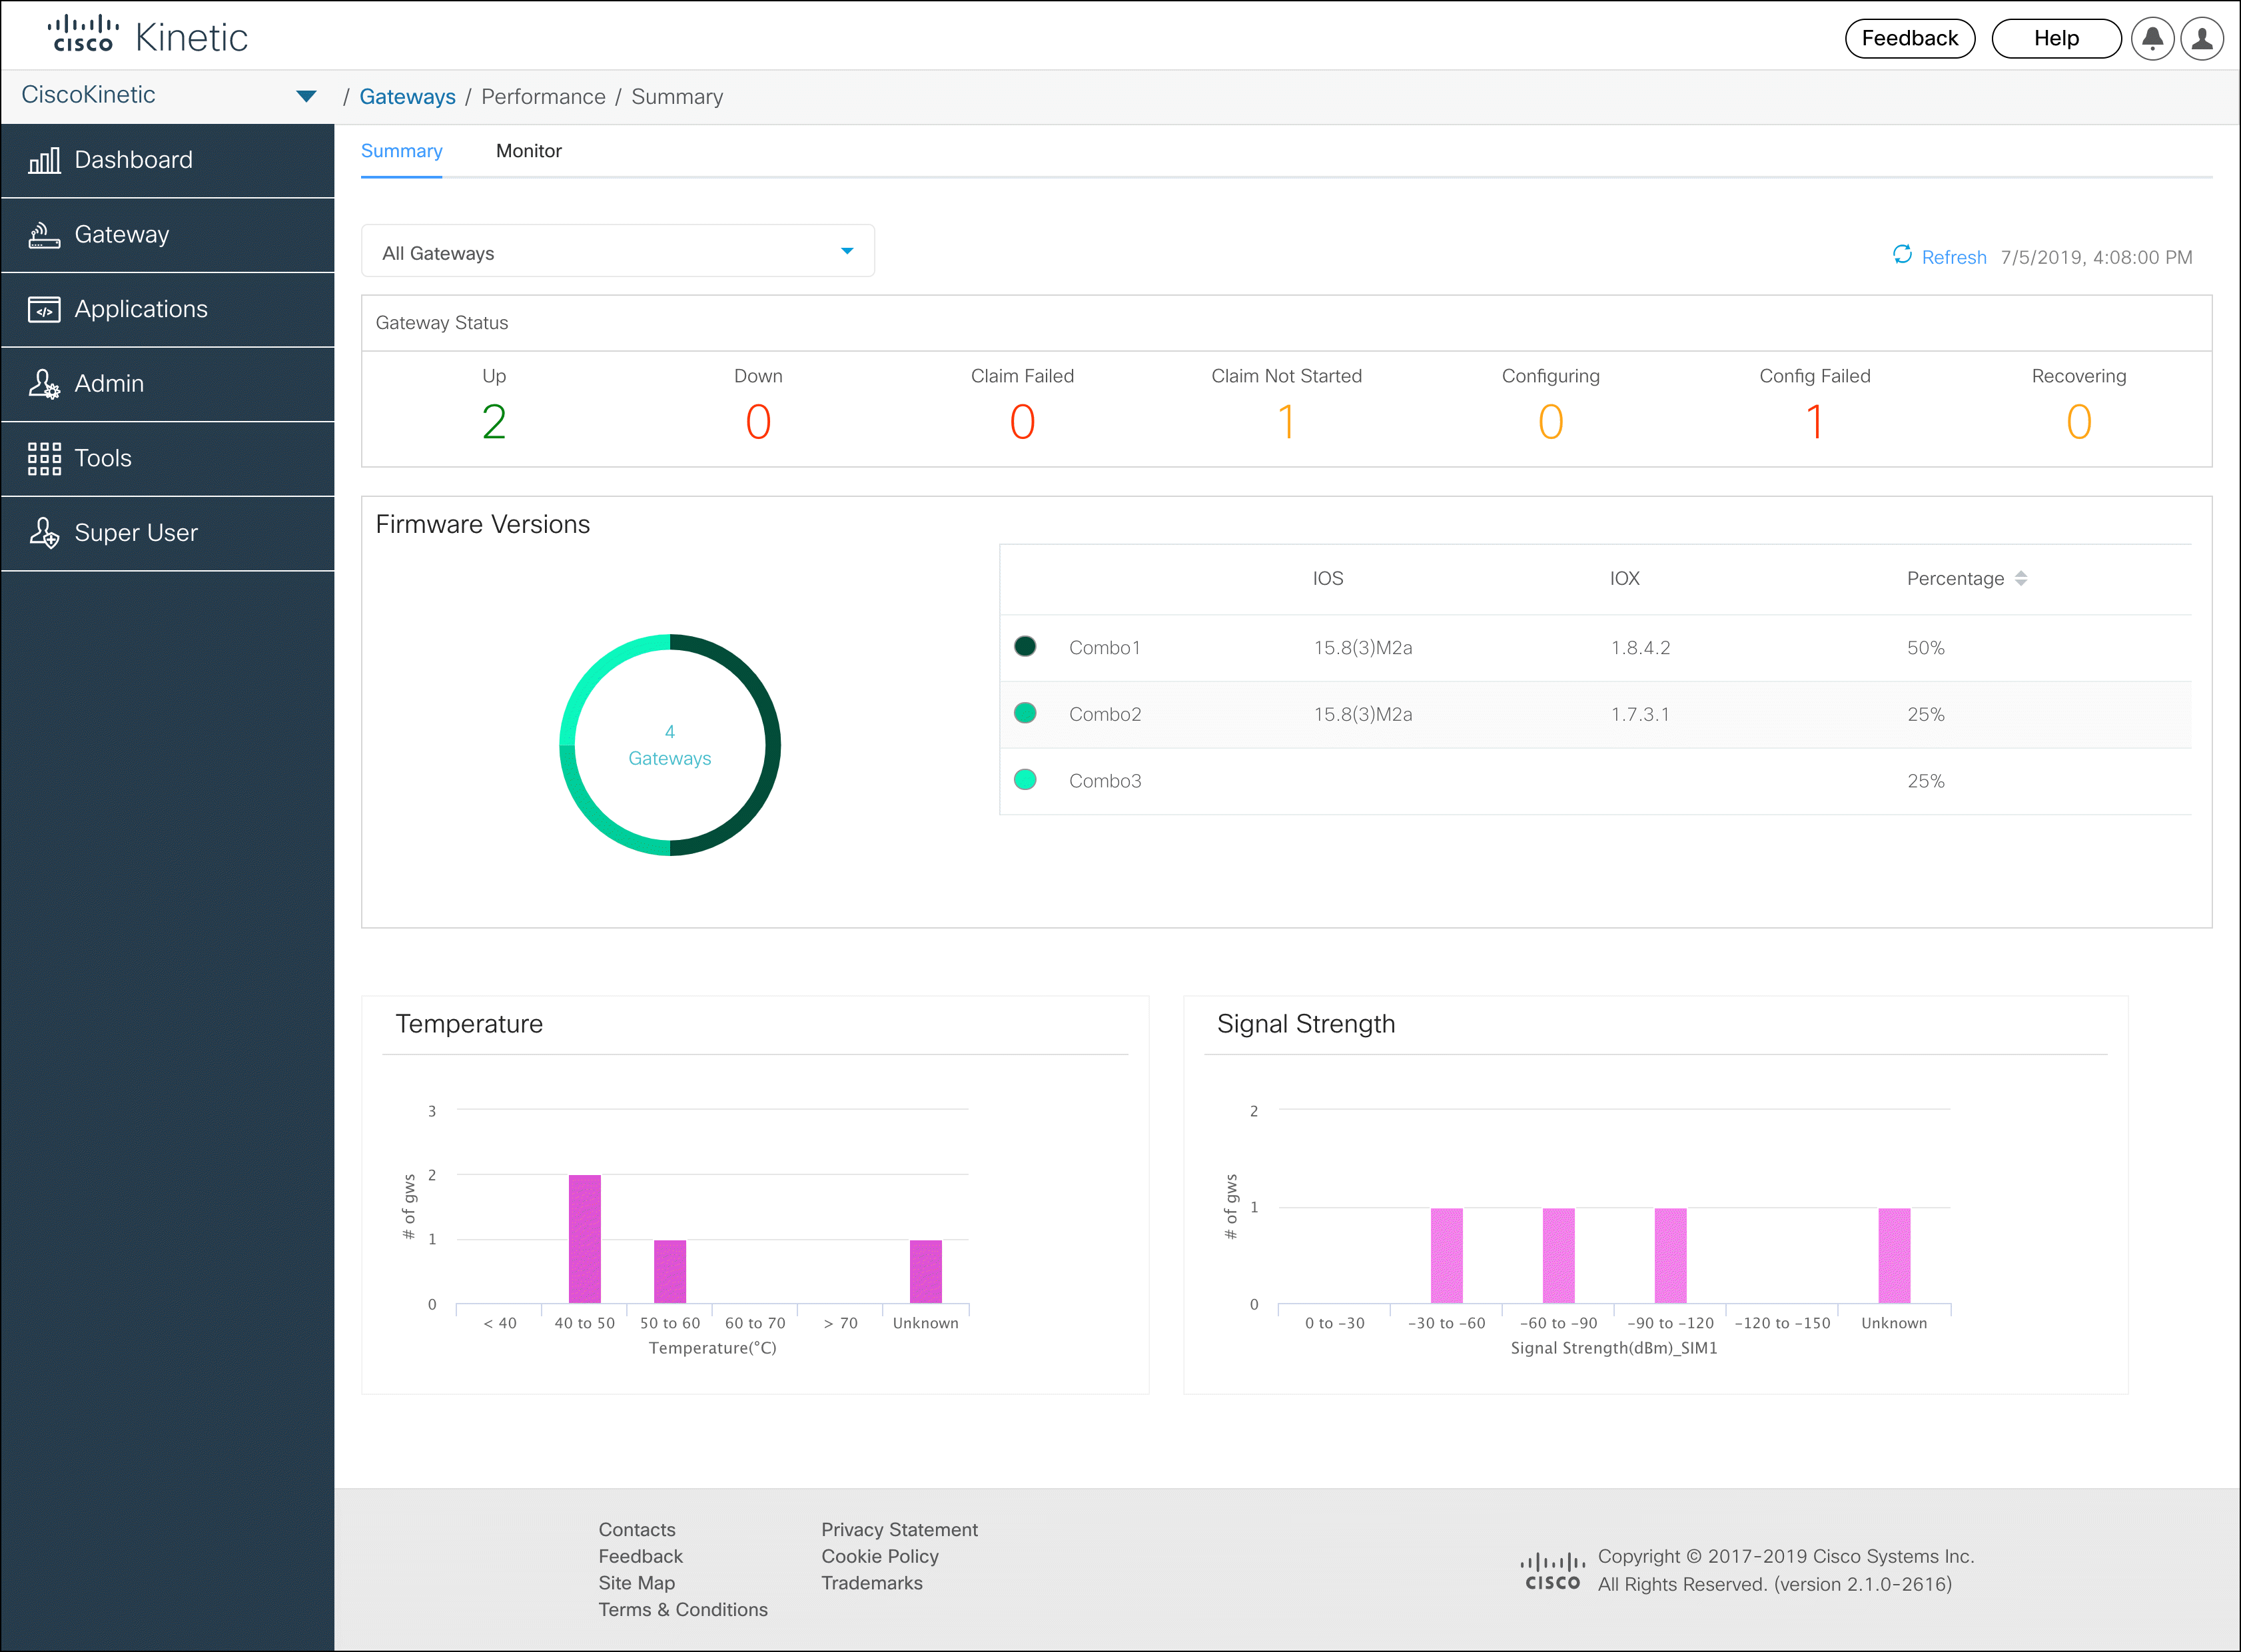
The Gateway > Gateways page has a multi-tab view that contains the following information:
Note: Gateway status is based on a heartbeat sent every 15 minutes.
Summary Tab
This tab provides gateway information such as gateway status, temperature, signal strength and firmware versions in a graphical format.
The gateway status can be one of the following:
| Status | Description |
|---|---|
| Up | Indicates that connectivity exists between GMM and the gateway. In addition, all the required configuration as specified in the template has been applied. |
| Down | Indicates that connectivity is lost between GMM and the gateway for over 30 minutes. |
| Claim Failed | Indicates that the gateway could not be claimed due to mismatch between the hardware (such as model#, expansion module) and the template. |
| Claim Not Started | Indicates that the gateway has not called home to GMM. This can be because the gateway is not powered on, does not have internet connectivity, or other reasons. |
| Configuring | Indicates that GMM is in the process of applying configuration specified in the template or is waiting for the user's input(such as advanced template variables, WiFi configuration etc.) to complete the configuration that needs to be applied. |
| Config Failed | Indicates that GMM failed to apply the configuration either fully or partially. Note: GMM will reattempt to apply the failed configuration up to 5 times. |
| Recovering | Indicates that the gateway is recovering from a connectivity issue with GMM. This status is indicated after the recovery time for the gateway has passed. |

Monitor Tab
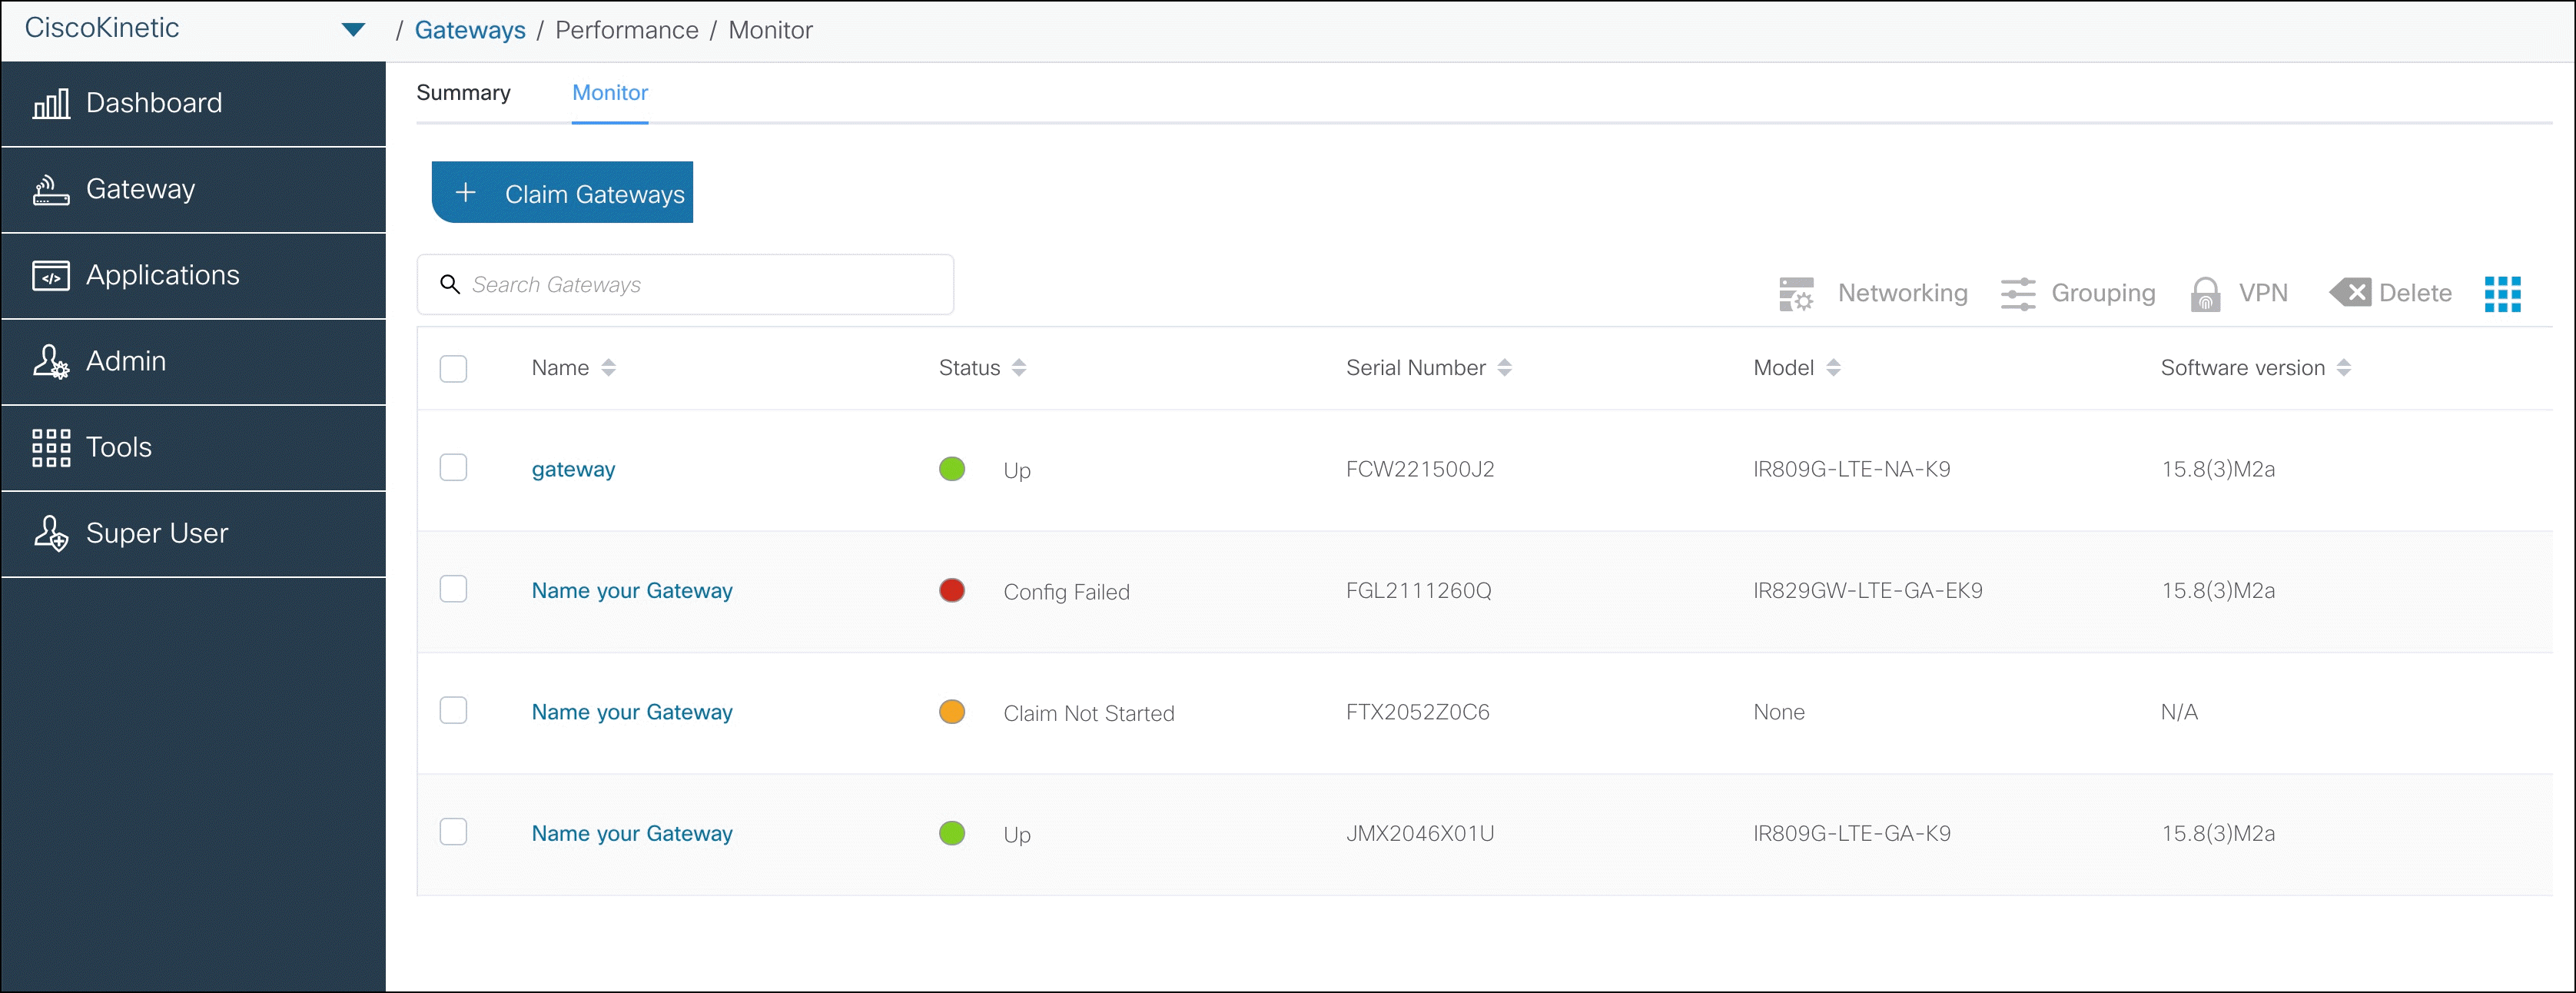
This tab lists all the gateways claimed by the organization. In addition, the gateway status ( Up, Down, Claim Failed etc) shown in the Summary tab is displayed in the Status column for each gateway.

Application status
The Gateway details page provides a summary for the application status. The application status is indicated by one of the following colors:
| Status | Description |
|---|---|
| Green | Indicates that the application is healthy and running. |
| Red | Indicates that the application is unhealthy or has failed. |
| Yellow | Indicates that the application has either stopped or is being configured. |
| Grey | Indicates that GMM is not aware of the current status of the application. |
| Not Applicable | Indicates that no applications are used in the organization. |

Detailed gateway information
- Select Gateway > Gateways and select the Monitor tab.
- Select a gateway name.
- Select the tabs at the top for more information.
| Tab | Description |
|---|---|
| Summary | Information about the device hardware, configuration, network settings, Custom Fields, and other information. |
| Monitor | If the gateway uses a cellular connection, the data usage and signal strength are displayed as graphs. |
| Current Config | The configuration specified on the device. |
| Apps | Displays the fog apps installed on the device. Use the Actions icons to start, stop, refresh, or uninstall the app. |
| Devices | Information about the devices managed by the gateway, such as the device IP address and the gateway MQTT server same, credentials, and topics. |
| Event Log | Displays logs for the gateway. See Event Logs below. |
| Diagnostics | See Diagnostics. |
View event logs
Use gateway logs to view the events and other information from the gateway and device.
- Select Gateway > Gateways and select the Monitor tab.
- Select a gateway.
- Click Event Log.
- Filter the results using a keyword search, time range or select an event type.
Note: Refresh the screen to update the results.