Editing a Smart Annotation
A smart annotation is a distinct element of your lab. You can edit a smart annotation’s properties to control how CML visually renders the smart annotation in the Workbench. Note that changing the smart annotation properties does not affect the underlying tag or the nodes that have that tag.
Open a lab with smart annotations in the Workbench. Ensure that you have toggled your Canvas Settings to show smart annotations.
Procedure
Click within the visual area of the smart annotation that you want to edit, avoiding any nodes or links.
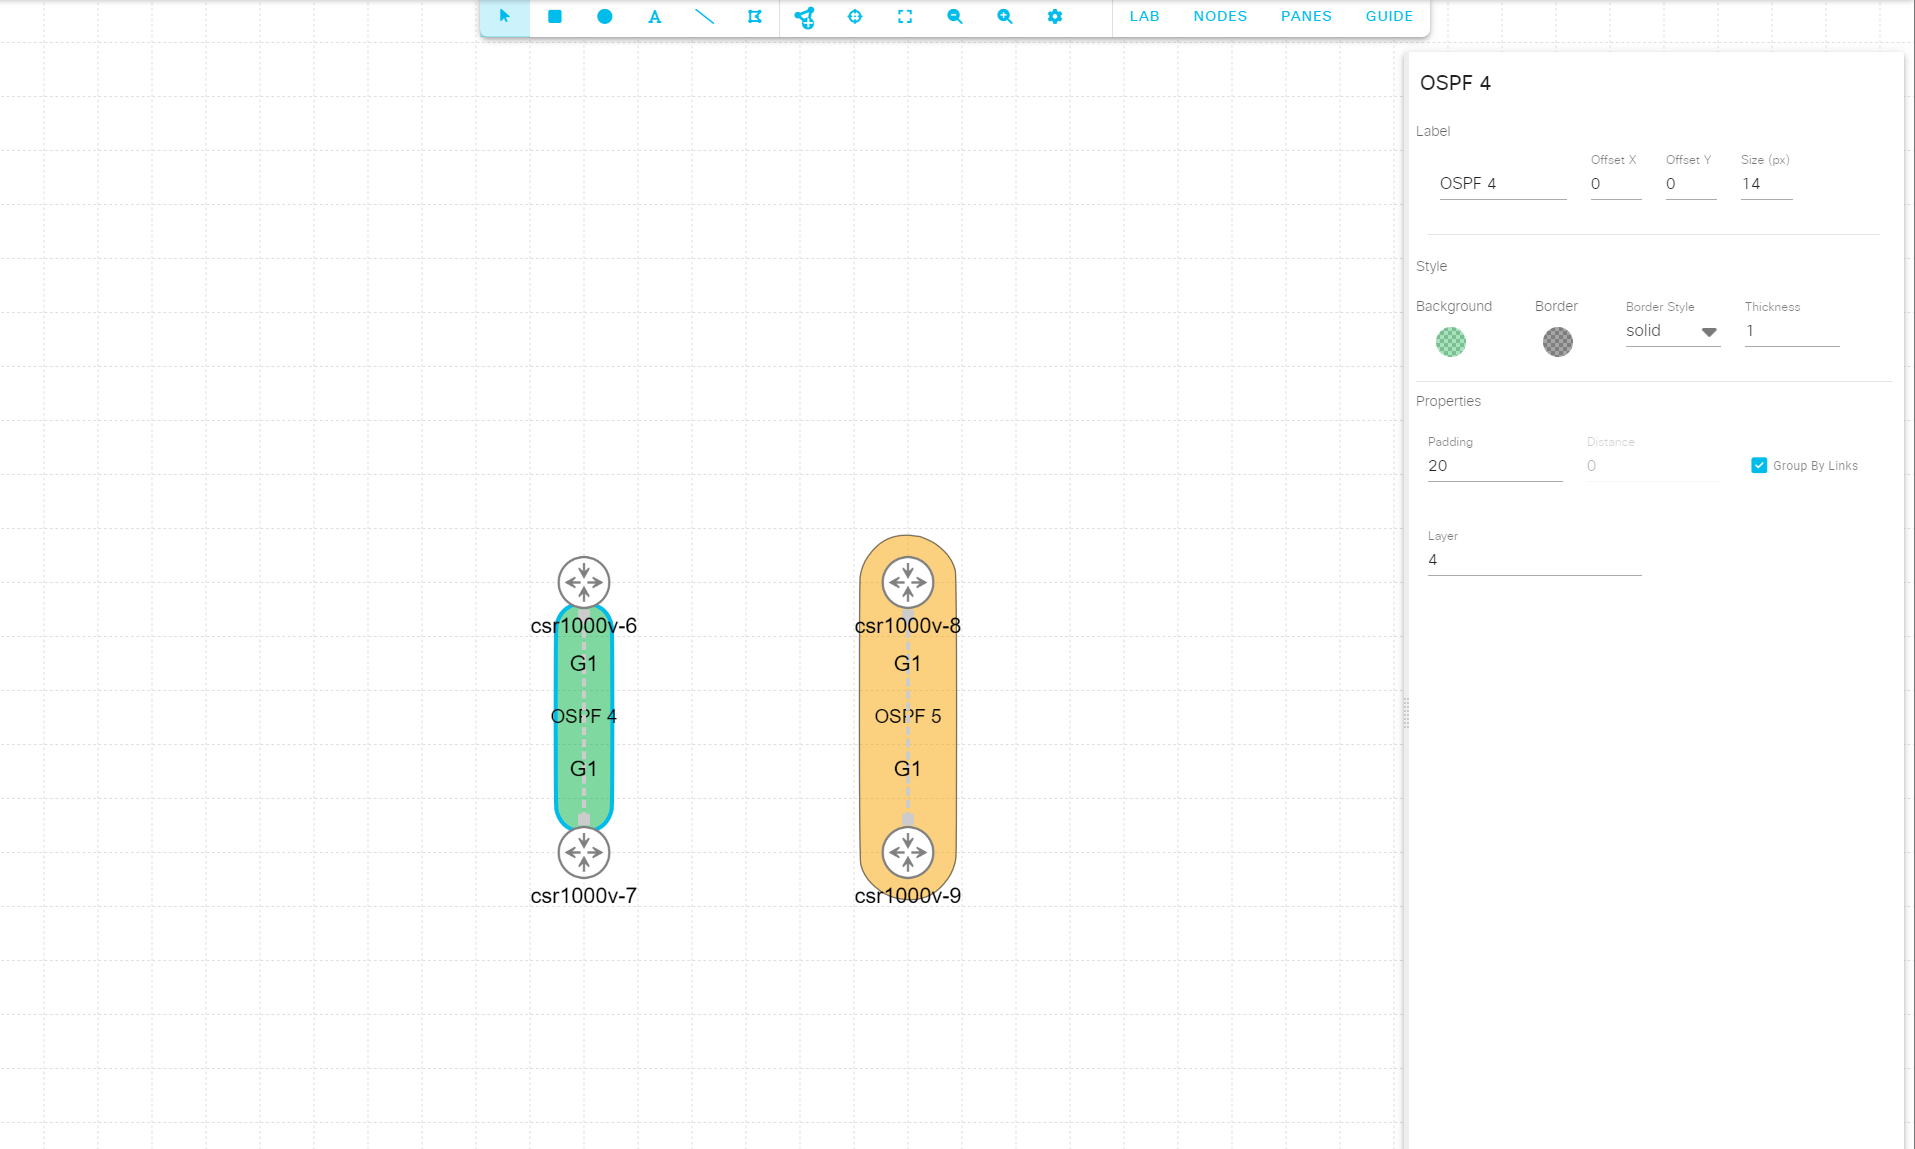
The annotation is selected and the Sidebar pane is shown with the smart annotation’s properties.
Change a property in the Sidebar to adjust the way that CML renders the smart annotation.
See below for an explanation of the different smart annotation properties.
That property on the smart annotation is updated, and the Workbench updates the visualization of the smart annotation to reflect the change.
Smart Annotation Properties
This section details each property of a smart annotation and how that property affects the way CML renders the smart annotation in the Workbench.
Label
CML draws a label at the centroid of the polygon for the smart annotation if multiple nodes are included within the polygon. Sometimes, that location may overlap with links or other topology elements, making the label difficult to read. In that case, use the offset properties to adjust the location where the label is rendered.
Label: The text to show in the label. By default, the label for a smart annotation is the simply the associated tag. Changing the label does not change the underlying tag.
Offset X: When CML draws the smart annotation’s label, it applies this horizontal offset to the default label location.
Offset Y: When CML draws the smart annotation’s label, it applies this vertical offset to the default label location.
Size (px): The size of the text used for the label.
The figure below shows the label being drawn at a y-offset of -67 which results in the label being displayed entirely outside of the annotation.
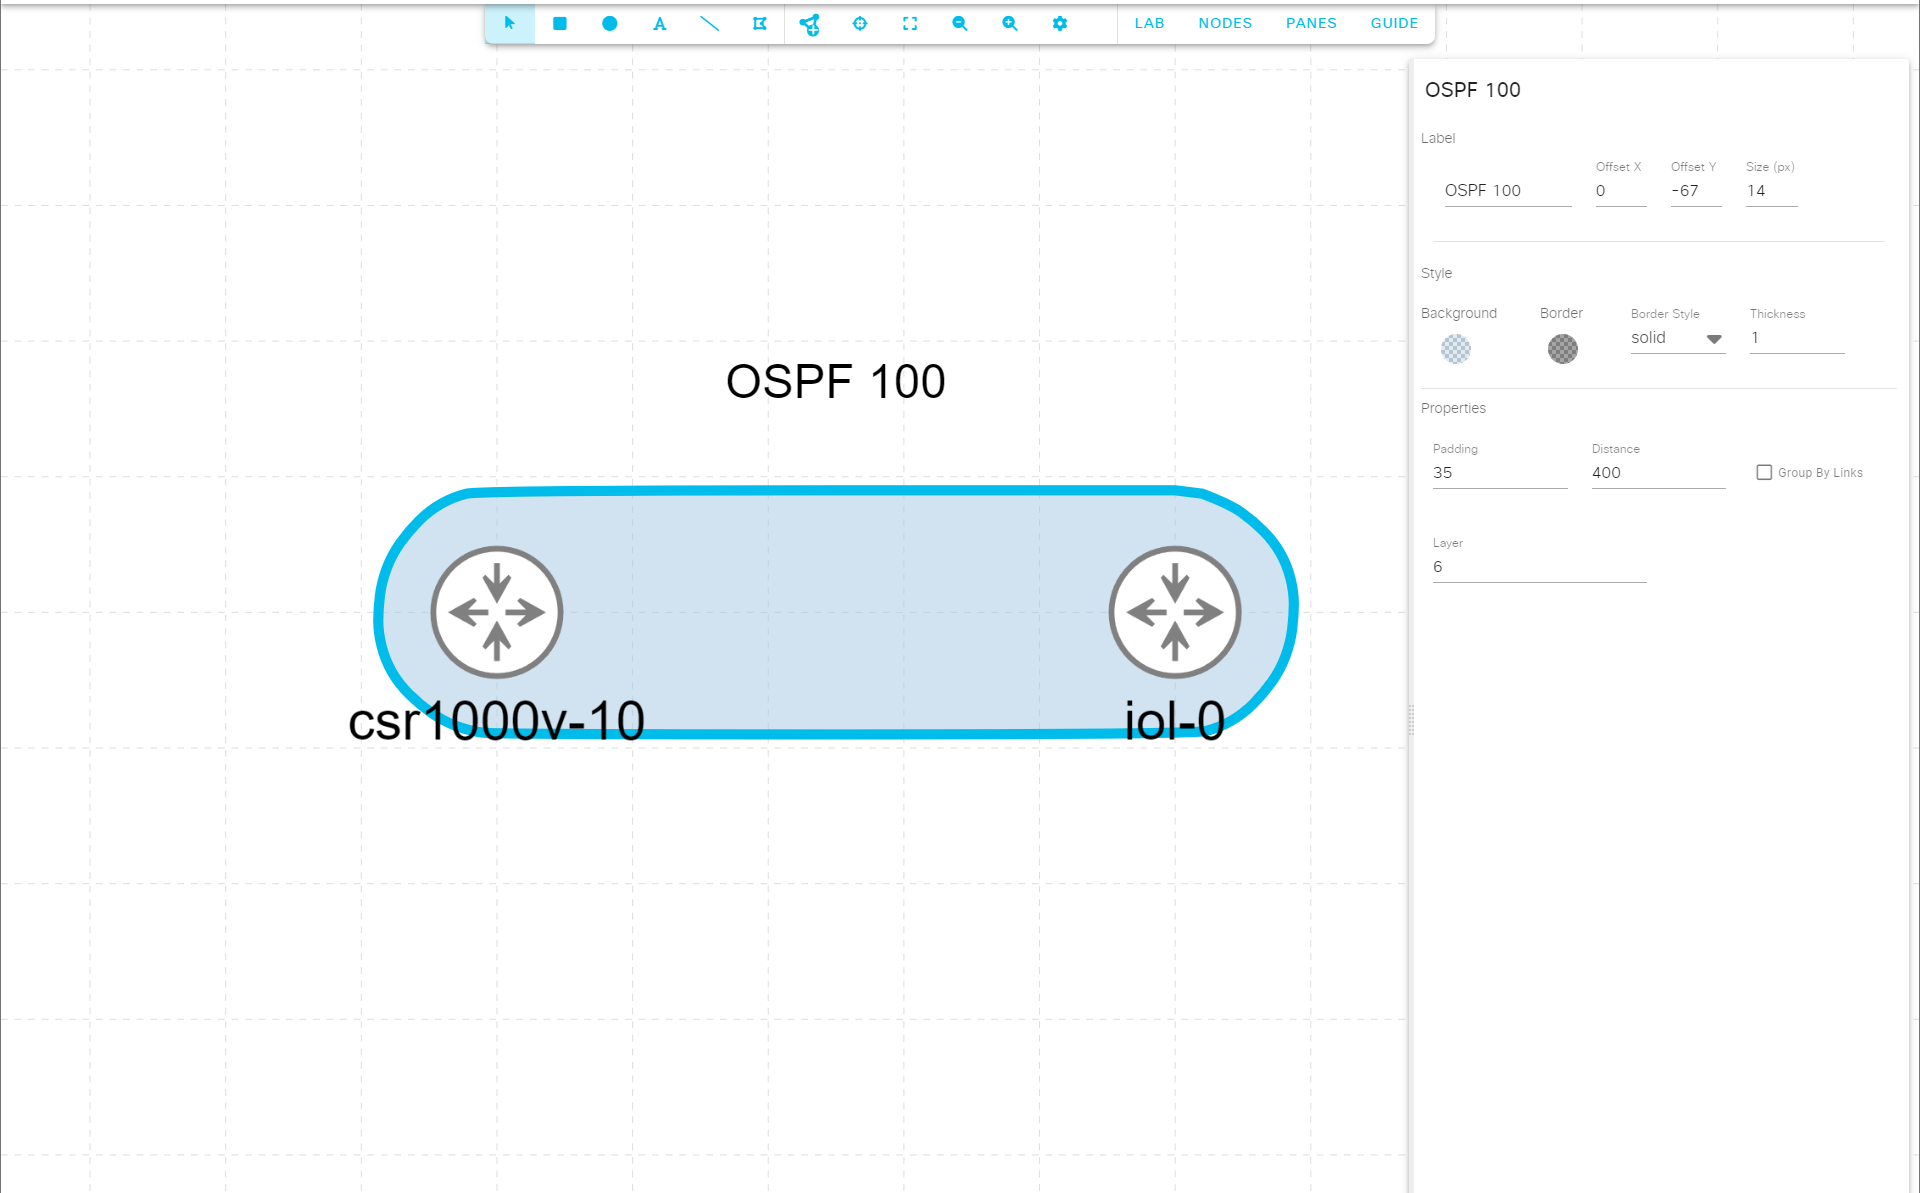
A smart annotation with a label that has Offset Y = -67, which causes the label to be displayed outside of this smart annotation
Background Color
Specifies the background color (or fill color) of the smart annotation. The body of the smart annotation is shown in this color.
The first time you add a new tag to a lab, CML creates a new smart annotation associated with the tag and assigns a random color to it.
Border
A border line is drawn along the edge of the visual area of the smart annotation. A few different properties affect how CML renders that border line.
Border Color: The initial border color for a smart annotation is always black with a 50% opacity.
Border Style: By default, the border style for all new smart annotations is a solid line.
Thickness: By default, the border of a smart annotation is 1 px thick.
Distance
This property defines the maximum distance between unlinked nodes that will be included in a contiguous polygon. The units for this value are pixels (px). For comparison, if you enable the display of the grid lines in your Canvas Settings, the grid shown in the Workbench is 50 px x 50 px.
When nodes are farther than this distance away from all other nodes with the smart annotation’s associated tag,
CML will render separate areas for the smart annotation. For example, in the next figure, the
Workbench shows two separate shapes for the OSPF 0 tag’s smart annotation because the horizontal
distance is greater than the specified distance property of 200.
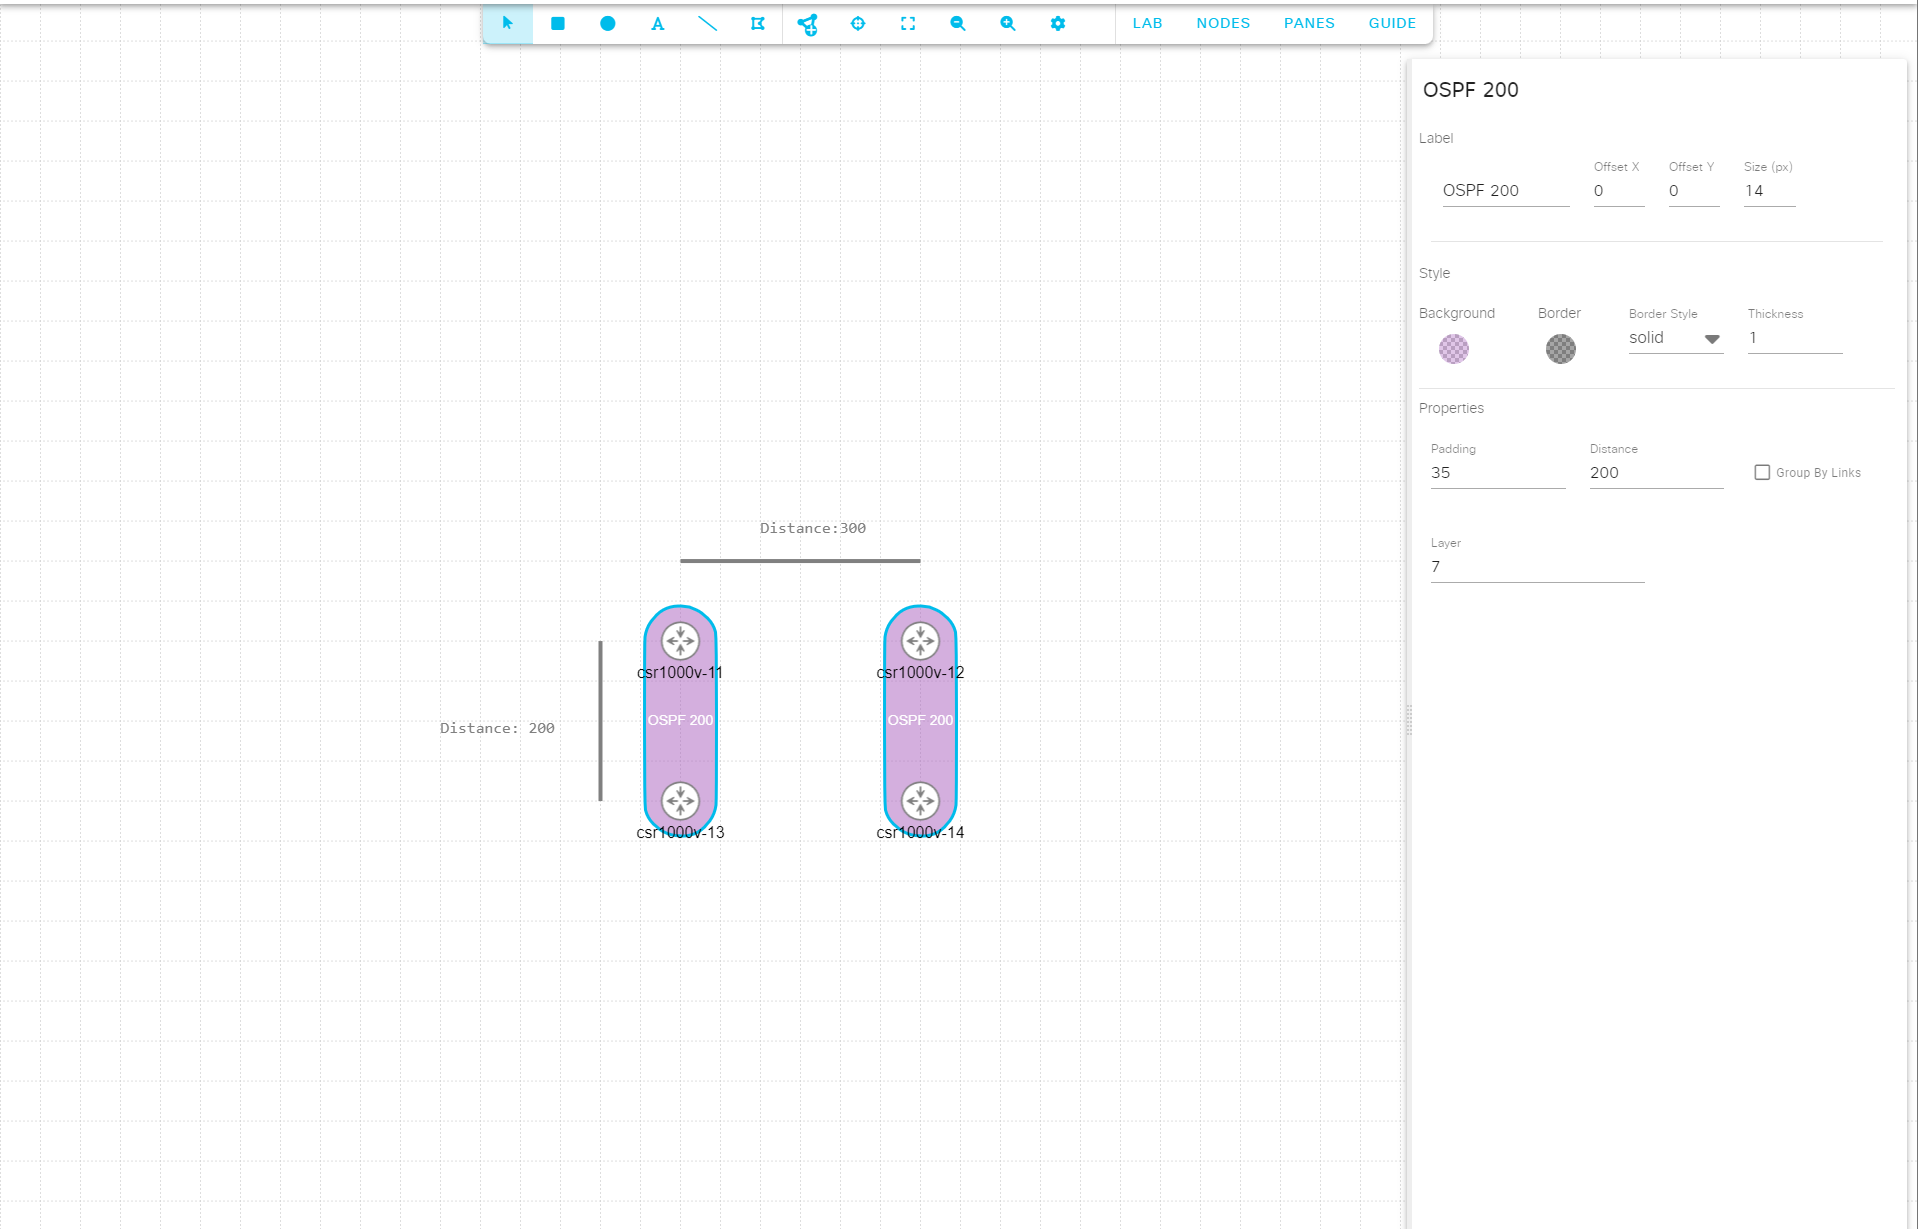
Illustration of the distance property of smart annotations.
Padding
The padding value specifies the distance around the centerpoint of the nodes within the smart annotation. The default padding value is 30. The next figure shows examples of different padding values.
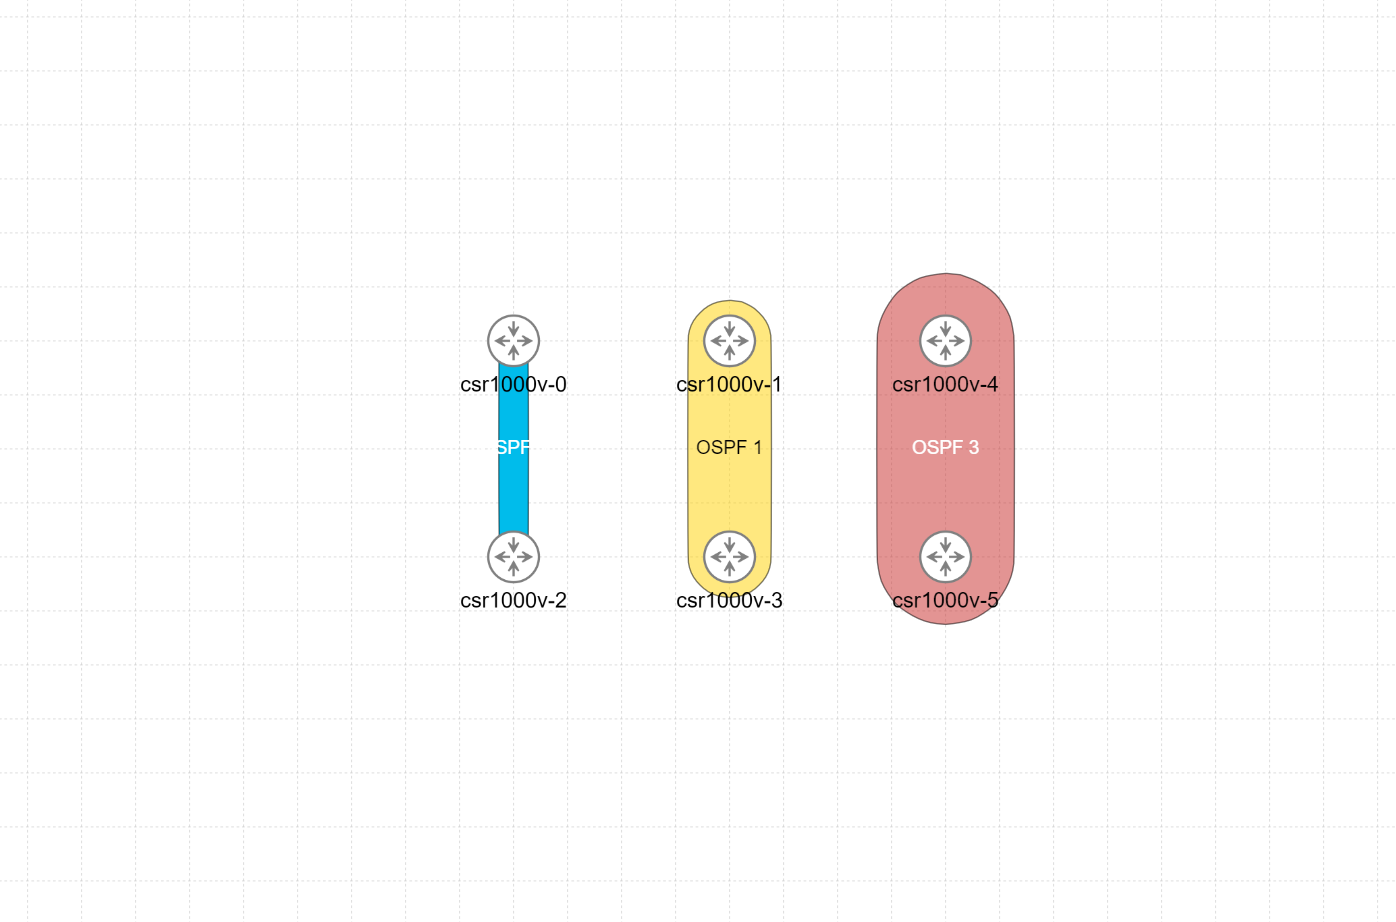
Padding values, from left to right: 10, 30, and 50
Layer
The layer determines the stacking order of the smart annotation. It is also called the annotation’s z-index. Smart annotations with smaller layer values are drawn first with higher numbers appearing above or on top of them in the Workbench canvas.
In the example below, we have a mix of annotations and smart annotations with differing layer values overlapping each other. Notice how the highest values are drawn on top of those annotations with lower values. When you click on an area of the Workbench where multiple annotations or smart annotations overlap each another, the annotation with the highest layer value is selected.
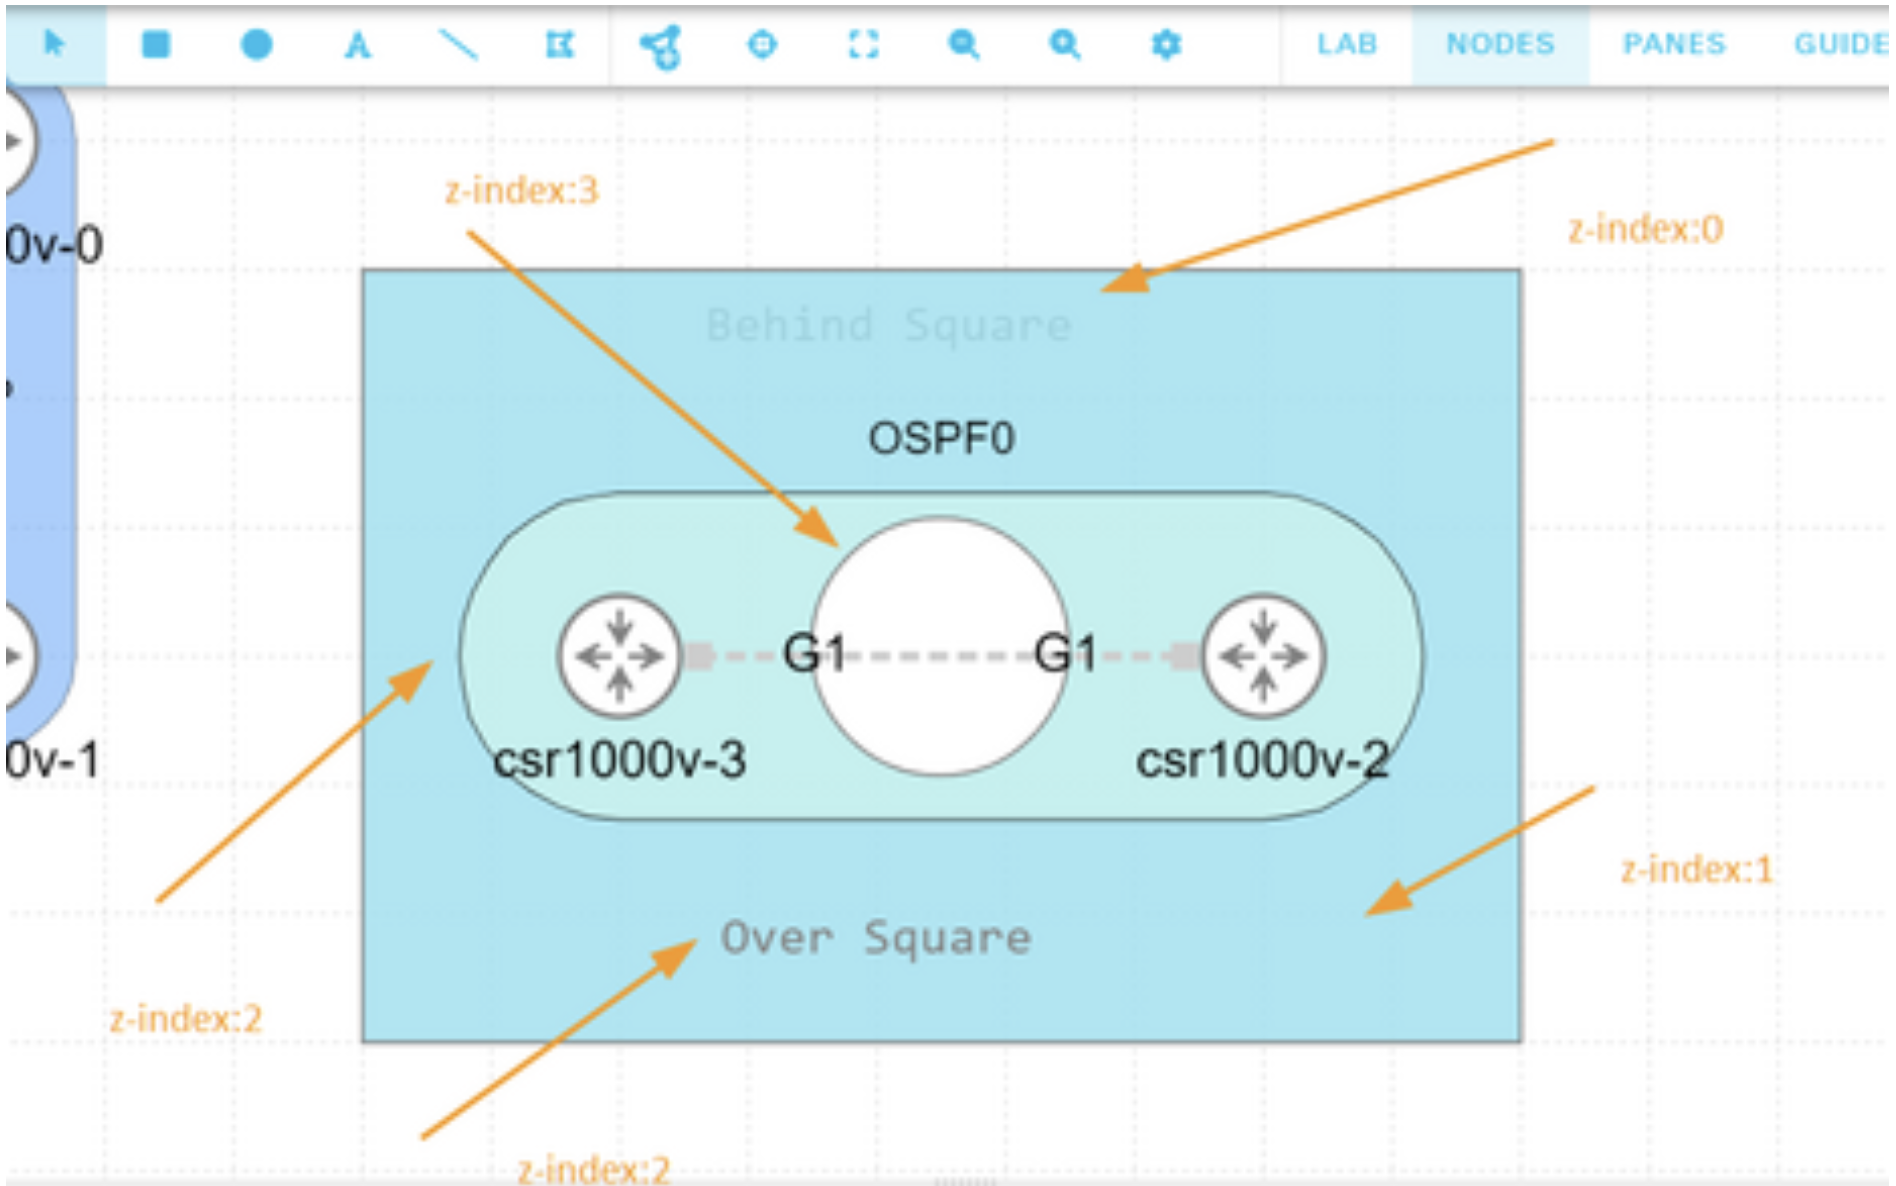
Examples of different smart annotation layer (or z-index) values
Group by Links
If you check the Group by Links checkbox, the smart annotation for the tag will be rendered differently. Instead of drawing the smart annotation as one or more polygons that contain all of the nodes with the tag, CML will just draw the smart annotation on the links between nodes with the tag. In this case, the Distance parameter is not used. All links between the nodes with the tag are annotated no matter how far apart the nodes themselves are.
Example of a tag whose annotation uses Group by Links