Monitor network device status
Alert: Cisco has made the end-of-life (EOL) announcement for the Cisco Edge Device Manager (EDM).
Dashboard summary status
Click Dashboard to view summaries of device status, cellular usage and signal strength and status over time. Refresh the page to see updated information. You can also view the location of your network devices on a map.
Click a number under Network Devices In Use or Active Alerts to see the detailed information for those devices or alerts.

Scroll down to see Top Gateways by Cellular Usage and Weakest Cellular RSSI (Recived Signal Strength Indicator) information. Use the drop-down arrow to change the data duration that displays. The default is 24 hours. The list shows the top-five LTE modems with the weakest cellular signal strengths. Hover over the "i" icon to see the details. The red-colored bars are the weakest. This is an example of typical US cellular carriers. The detail pop-up shows the date, Module ID, the RSSI level, the SIM Slot, and the carrier.

To change the time interval of the graph display on IoT OD:
- Click the drop-down arrow on the graph at the far right. The default is Last 24 hours.
Note the colored dots on the map.
| Color | Description |
|---|---|
| Green | A device exists in the specified location on the map that is up. |
| Orange | A device exists in the specified location on the map that is in Configuration Failure mode. |
| Red | A device exists in the specified location on the map that is down. |
| Blue | A device exists in the specified location on the map. When you click this dot, the IoT OD displays a more local map. |
Click a colored dot. The monitoring sidebar appears.
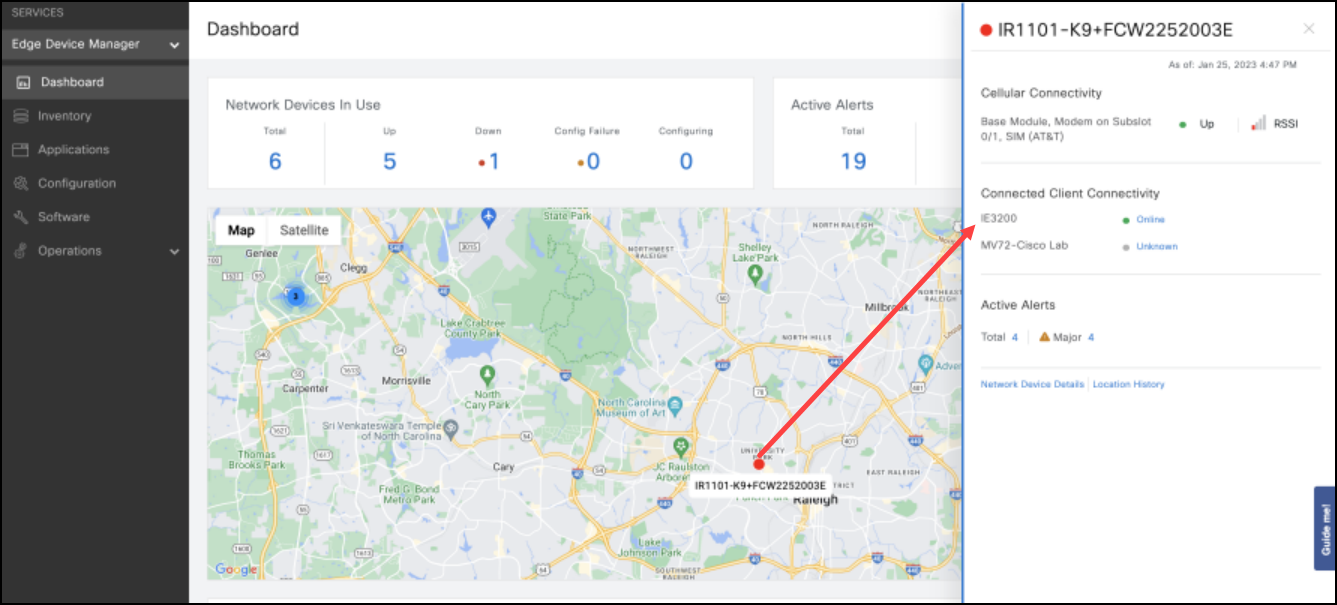
The screen displays the following data for the subslots in the module of the device:
- The subslot indicated as either 1 (<slot/port>1/0 or 1/1) or 0 (<slot/port> 0/0 or 0/1) or 0/1 (<slot/port/interface> 0/1/0 or 0/1/1).
- The carrier connected to the module.
- The Received Signal Strength Indicator (RSSI) value that indicates the strength of the module signal.
- The cellular status of the SIM, either up (green) or down (red), indicated by the colored dot to the left of the RSSI bars.
- The device status, either up (green) or down (red), indicated by the larger colored dot to the left of the device name in the dashlet.
Health Status Descriptions
To access detailed information on your devices, click one of the states from the above screen, or click Inventory.
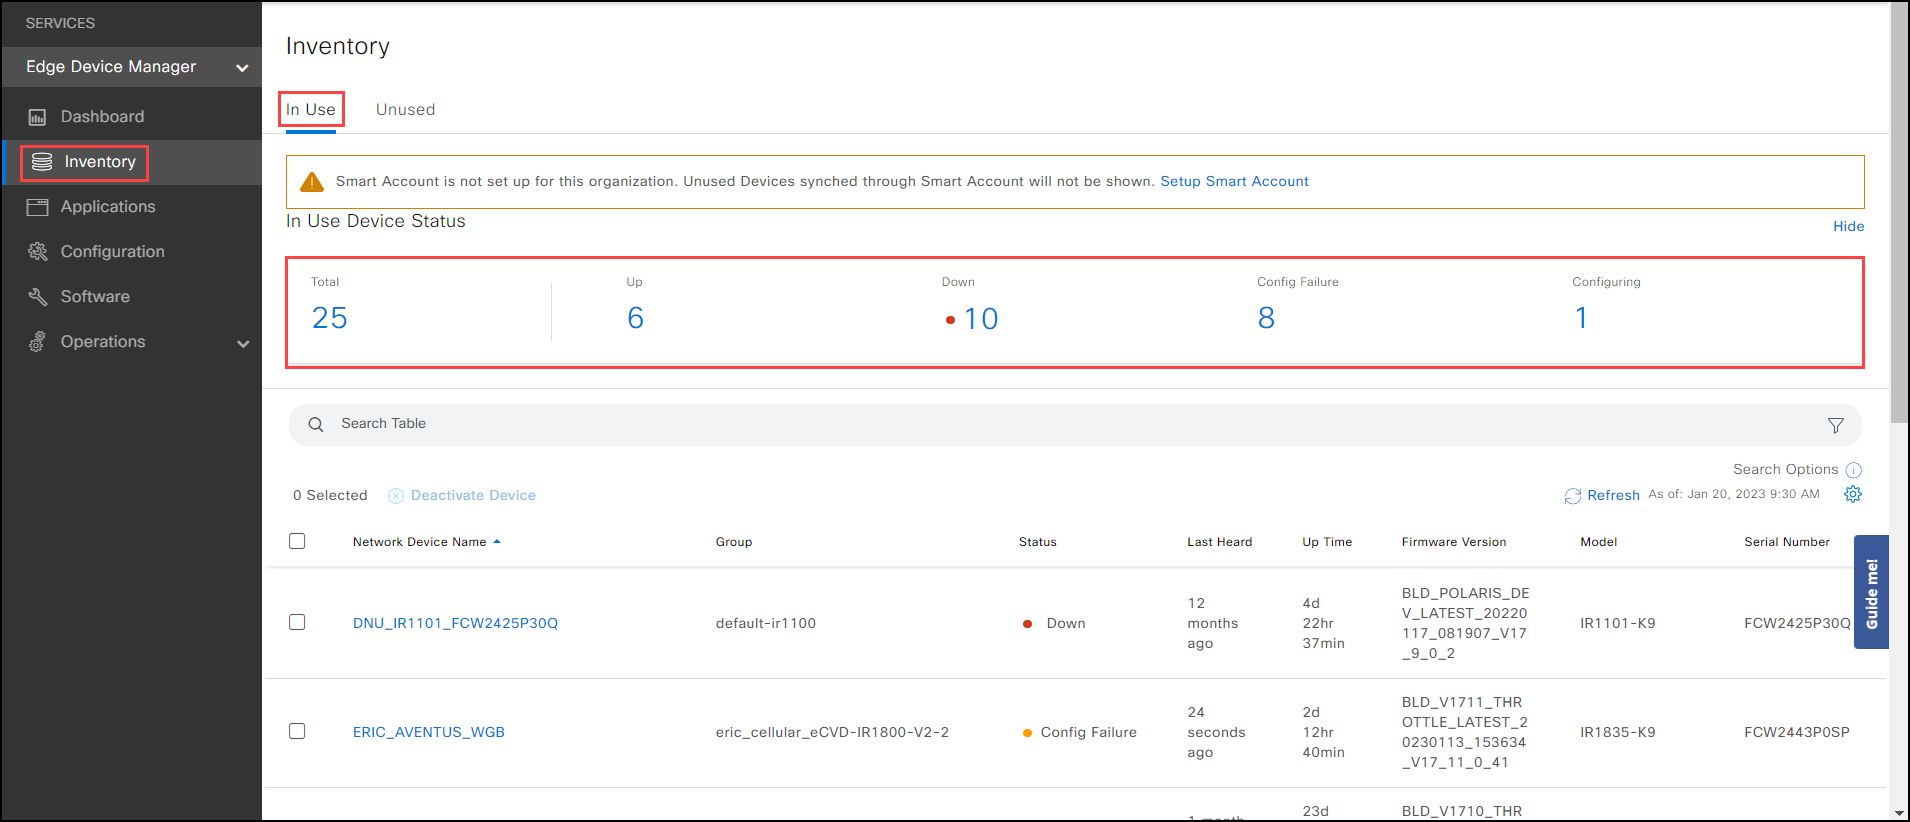
Note: Refresh the page to see updated information.
The network device states can be one of the following:
| Status | Description |
|---|---|
| Total | Indicates the total number of network devices being monitored. |
| Up | Connectivity exists between Cisco IoT Operations Dashboard (OD) and the network device. In addition, all the required configurations as specified in the template have been applied. |
| Down | Connectivity is lost between Cisco IoT OD and the network device for more than 30 minutes (default) or the custom mark device offline setting in the Group Properties > Timer Settings. |
| Heard | Indicates that the network device successfully called home to Cisco IoT. |
| Unheard | Indicates that the network device has not called home to Cisco IoT. This can be because the device is not powered on, does not have internet connectivity, or other reasons. |
| Configuring | Indicates that network device is in the process of applying the bootstrap configuration and template, as well as any time the device configuration is being pushed. |
| Config Failure | Indicates that the network device failed to apply the specified configuration and/or push that configuration to the device. |
Click on a state to filter all the devices by that state.
To modify the Timer Settings for all network devices in a Configuration Group:
Click Configuration. Select a Group of devices from the list.
Click Edit Group.
Click the Properties tab.
Expand Timer Settings. The following are the Timer defaults:
- Mark device OFFLINE after 30 minutes
- Heartbeat Interval: 15 minutes
- Metric Interval 30 minutes
Note:
- For new customers, the Metric Interval timers can be set from 10 minutes to four days. This reduces the cellular data costs.
- For existing customers who have already set the Metric Timer intervals, there is no impact to your settings.
- Use the drop-down arrow to choose a new parameter of Minutes, Hours, or Days for both the Mark device OFFLINE and the Metric Interval. Type in your valid choice.
- Set a Heartbeat Interval between 1 and 15 minutes.
- Click Save.
View detailed device information
- Click Inventory to view a summary of all network devices for the current organization.
- Click a specific network device for detailed information.
- Select the tabs at the top for more information.
| Tab | Description |
|---|---|
| Summary | The Summary screen provides this information about each In Use device: Hardware details: Shows details on the devices in use. * Managed by: The IoT Operational Dashboard EDM service. * Name: The name of the device. * Serial Number: The serial number of the device. * IP Address: The IP Address that belongs to the device. * Firmware Version: The version of Firmware that the device is using. * Last Heard:The time span in hours and minutes since the device was functioning. * Uptime: The time span the device has been operational. * Open Issues: Any issues associated with the device. Cellular Details: If the device is using a SIM card(s) to create a cellular connection. * Cellular Status (SIM1): The status of the cellular connection of the device's SIM card. * Cellular Connection Type (SIM1): The connection type (LTE, Ethernet). * Cellular Connection (SIM1): The cellular provider. * IMEI (SIM): The International Mobile Equipment Identity number of the device. * MSISDN (SIM1): The Mobile Station Integrated Services Digital Network to identify the device. Wi-Fi Details: If a Wi-Fi Module is plugged into the device. * Wi-Fi Module Status: The status for the Wi-Fi module. * Wi-Fi Mode: The mode the Wi-Fi module using such as: WGB, Controller (CATWAP), WGB with Hotspot). * Uplink Admin Status (Up or Down): The uplink status of the Wi-Fi module. * Uplink Connection Status (Up or Down): The status of the uplink connection. * Hotspot Admin Status: If the device is configured with WGB with Hotspot. * Hotspot Admin Status: Shows if the device is configured with WGB with Hotspot. |
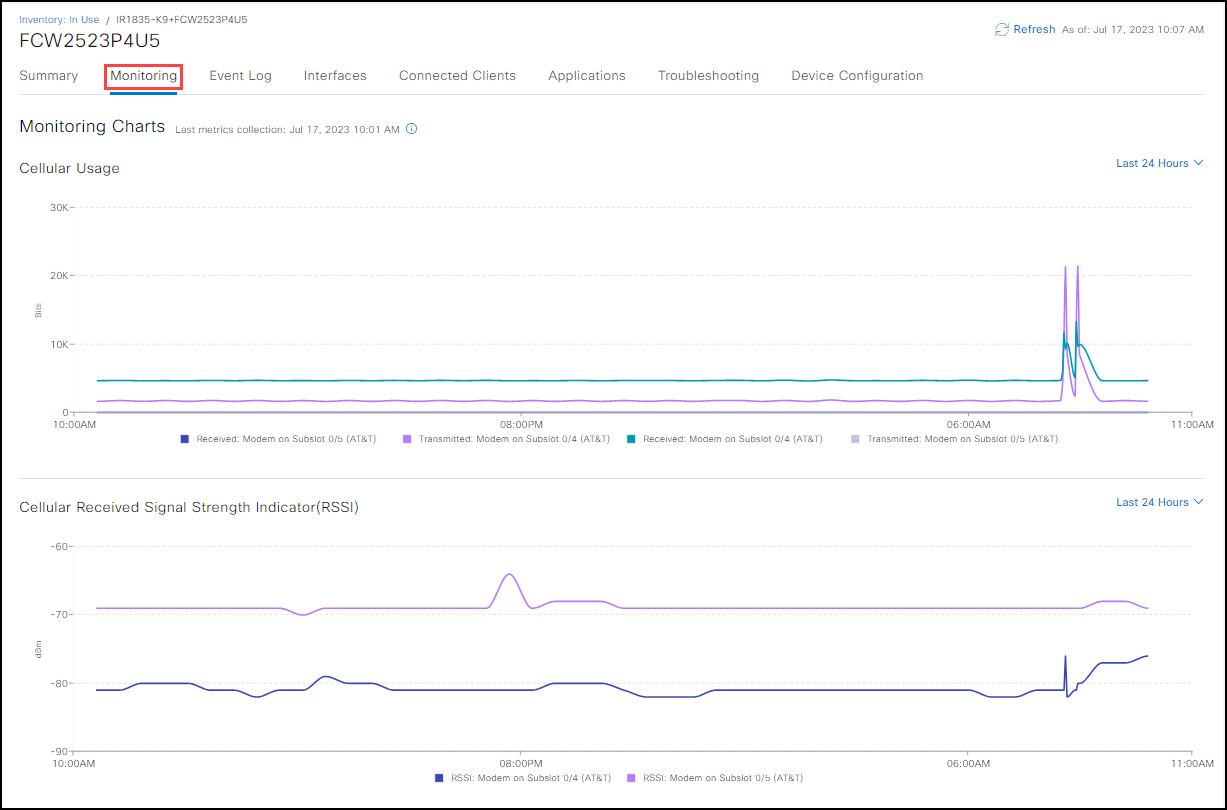
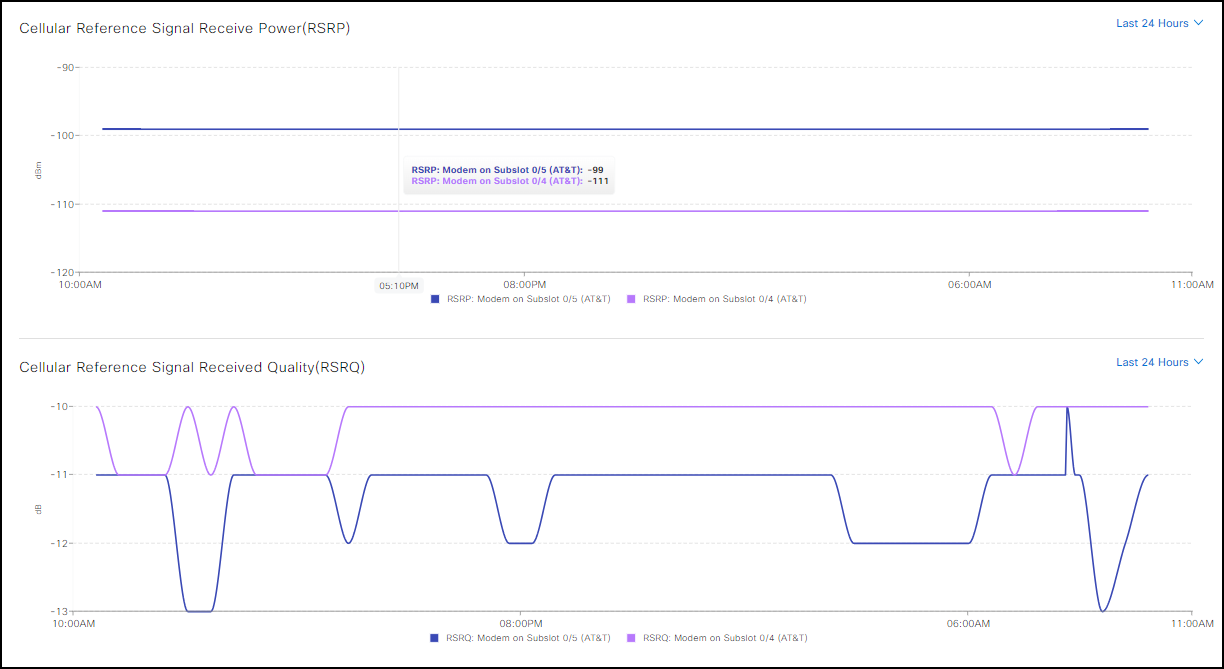
| Monitoring | The Monitoring screen provides the following cellular information of the device (if a Wi-Fi module is plugged into the device). All graphs can be configured for the following time frames: * Last Hour * Last 6 Hours * Last 24 Hours * Last 7 days * Last 30 days Cellular Usage: Shows cellular usage. Cellular data is the data your device uses for Internet access, allowing your device to download information from web browsers. Cellular Signal Quality (RSSI): Shows the measurement of the power present in a received radio signal. Cellular Reference Signal Received Power (RSRP): Shows the linear average of reference signal power (in Watts) across the specified bandwidth in resource elements. Linear average is defined as an average set of values that reduces the signals, noise and background vibration. Cellular Reference Signal Received Quality (RSRQ): Shows a measurement of the quality of the received reference signal. Cellular Signal-to-Noise Ratio (SNR): Shows the ratio of signal power to noise power. Wi-Fi Usage: Shows Wi-Fi usage for Wi-Fi Uplink and Wi-Fi with Hotspot (Dot11Radio1 and Dot11Radio0). Wi-Fi Clients: Using a WGB with Hotspot, shows the number of clients using the hotspot. |
| Event Log | The Event Log screen displays logs for the lifecycle of the network device and shows audit event log information. |
| Interfaces | The Interfaces screen provides information about the device interface configurations and has two views: Interface view: Provides interface information in tabular format along with a link to the Module ID attached to the device. See Mapping Modules for IR Devices for more information. Module view: Provides the same information in tabular format organized by module. It also provides a Module Details slide out screen that shows subslot information. See Mapping Modules for IR Devices for more information. For customers using WGB plus Hotspot, both the interface and modular views show two specific interfaces, Dot1Radio0 and Dot1Radio1, that list the Wi-Fi information. The Module ID has a specific subslot, NIM subslot 0/3, that provides the Wi-Fi configuration module information. See Mapping Modules for IR Devices for configuration information. |
| Connected Clients | Connected Clients are subtended devices that are connected to the network devices in your organization. Learn More |
| Troubleshooting | Use the Troubleshooting screen to Ping IP address, traceroute IP address, IOS (show commands), reboot device(s), refresh metrics on the device(s), or factory reset. For metrics information, timer settings, and location tracking and operation, see Manage Configuration Group. For information about using the Troubleshooting run commands, see Troubleshotting Issues. To verify that a troubleshooting command was executed on the device(s), click Inventory from the left panel > select the device from the list > click the Event Log tab, and find your device in the table. Click Refresh to verify. To verify that a troubleshooting command was executed on the device(s), click Inventory from the left panel > select the device from the list > click the Event Log tab, and find your device in the table. Click Refresh to verify. If the device(s) are not UP, the troubleshooting configuration operation or regenerate password operation will fail. The devices must be UP and discovered. |
| Device Configuration | Use Device Configuration to push the configuration to a device, view the current running-configuration, and view the Access Point configuration (where applicable). You can also download the running configuration and AP configuration. |
To monitor the device information:
- Select Inventory > In Use. The Network Devices In Use screen opens and lists the current list of devices.
- Click the appropriate device from the list. The device Summary screen opens.
- Click the Monitoring tab. The following graphs display, depending on your device and setup.
For cellular networks, when a mobile device moves from cell to cell and performs cell selection/reselection and handover, it measures the signal strength and quality of the neighboring cells. In this process of handover, the LTE specification provides the flexibility of using RSRP, RSRQ, or both. The graphs below display the data.
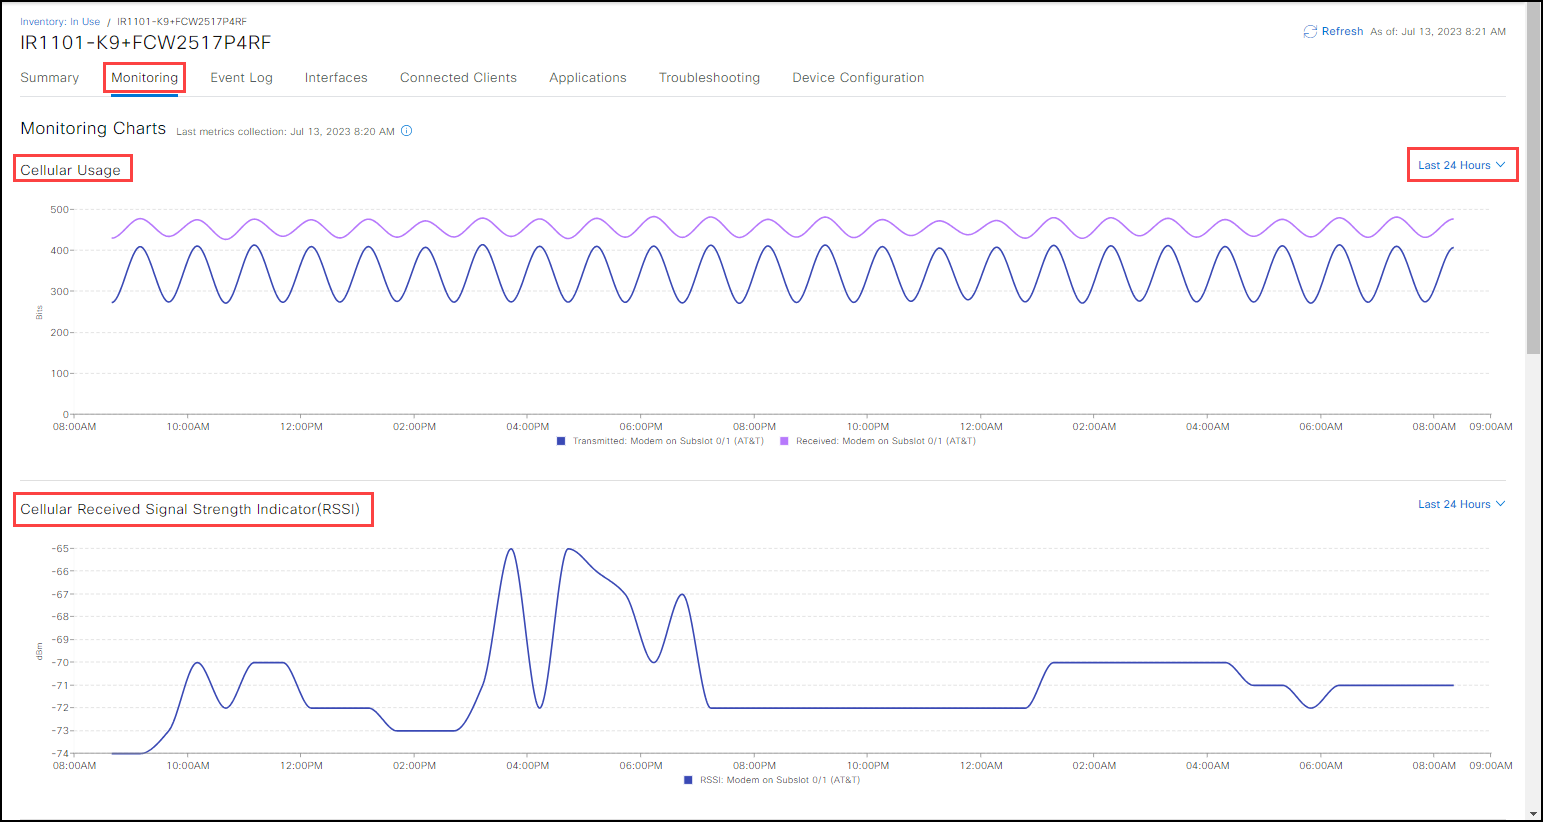


Note: If you are monitoring an IR829 device, there is built-in Wi-Fi access point. If you are monitoring an IR1800 series device, you can plug in a Wi-Fi module access point. In these instances, the Monitoring tab will show two additional graphs: dot11Radio traffic 0 and 1. These show the time and speeds. Set the intervals with the drop-down arrows. The defaults are Last 24 Hours.

Here are the graphs visible for the IR1800 devices.
