SEA: Dashboard
Note: Dashboard is only available to SEA System Admin or SEA Access Admin users.
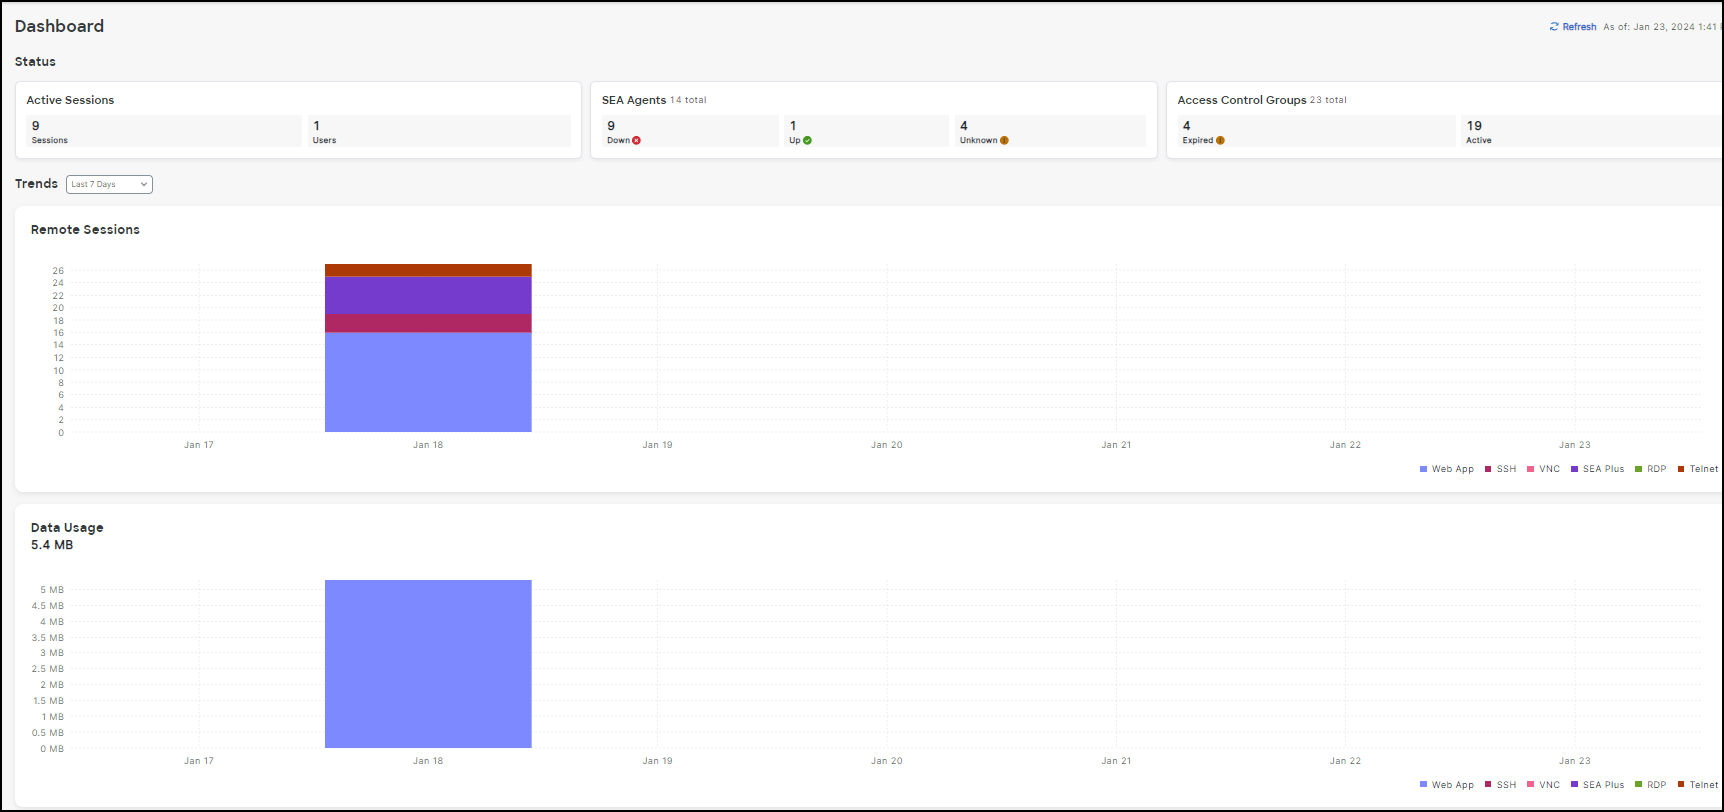
The Secure Equipment Access (SEA) Service provides a Dashboard that shows an aggregated view of the current status of all Active Sessions, SEA Agents, and Access Control Groups. It also displays trends of the remote sessions and data usage over time. The SEA Dashboard is designed to help the OT Admin to monitor key SEA data points and trends and react quickly to any problems. Click any of the dashlets to see more details.
Status
In the Status section, there are dashlets:
- Active Sessions
- Sea Agents
- Access Control Groups
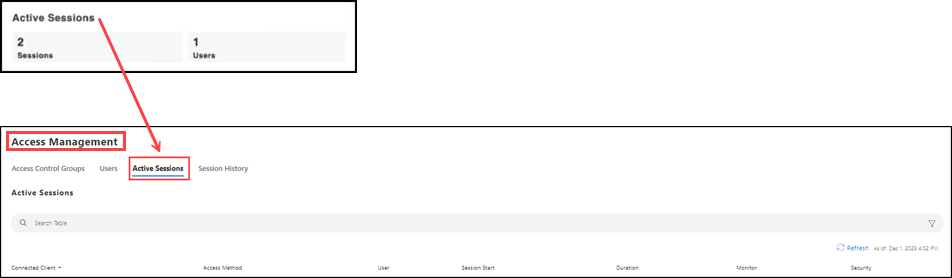
Active Sessions
This dashlet lists any Active Sessions and Users. (This example shows that 1 user has 2 sessions open.) Click in the dashlet and the Access Management screen opens to the Active Sessions tab.
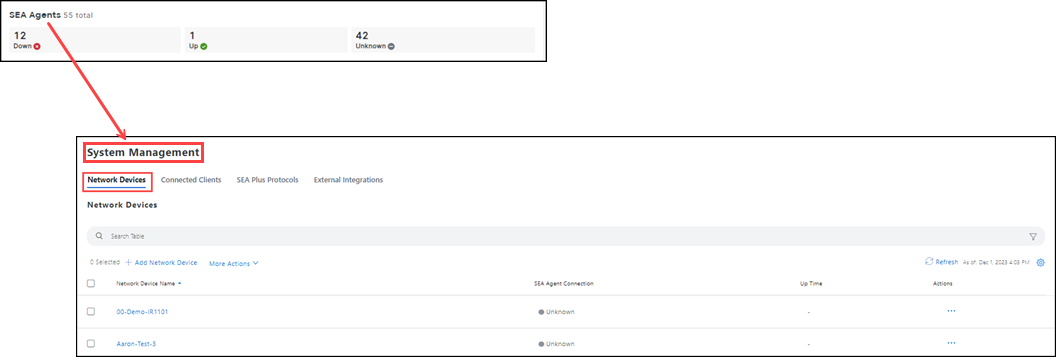
SEA Agents
This dashlet lists any Network Devices with installed SEA Agent and their status (down, up, or unknown). Click in the dashlet and the System Management screen opens to the Network Devices tab.
Note: The Down status can include Down:Pending Delete and Deleted states.
Access Control Groups This dashlet lists Access Control Groups. Click in the dashlet and the Access Management screen opens at the Access Control Groups tab.

Trends
The Trends section of the SEA Dashboard lists either the last 7 days, last 24 hours, or last 30 days (drop-down list). Each graph lists what Remote Sessions were created and what Access Methods were used.
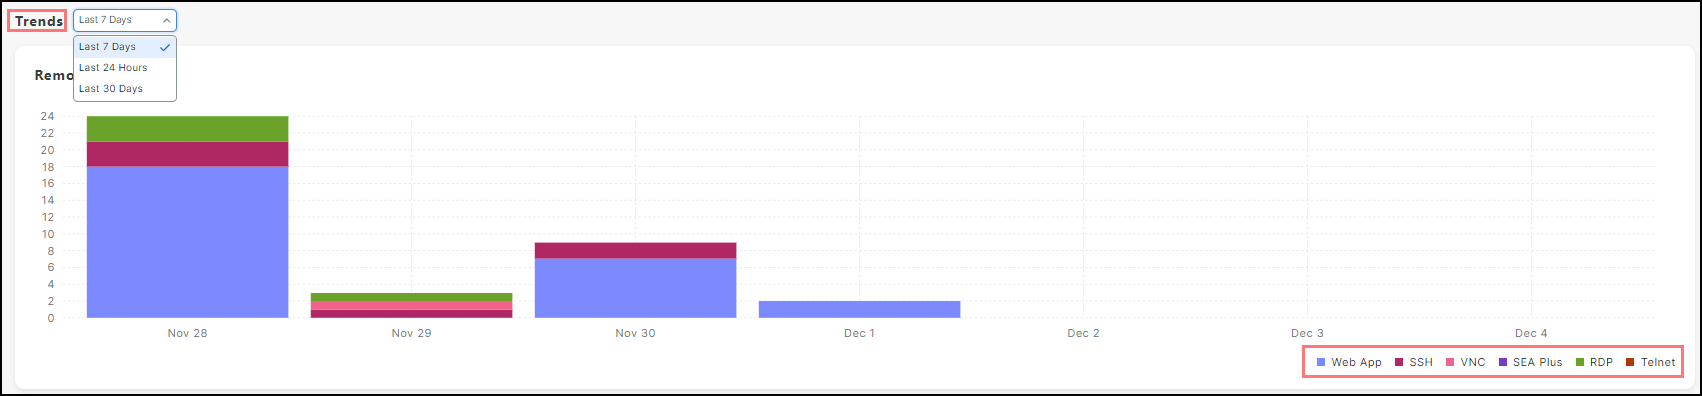
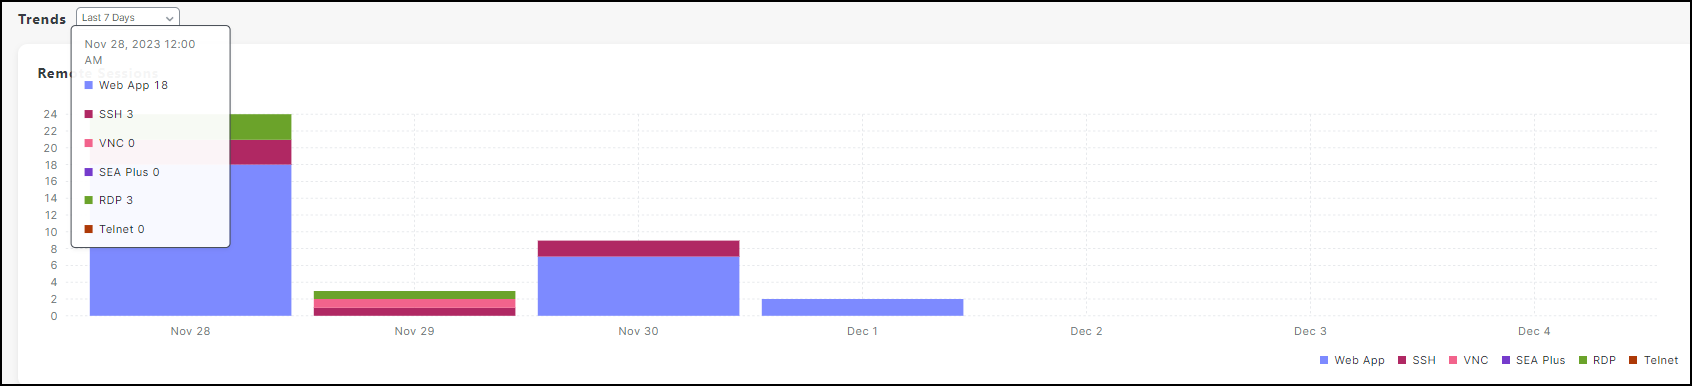
Roll over a graph to show how many sessions are open and which Access Method (color coded) is used for that session.
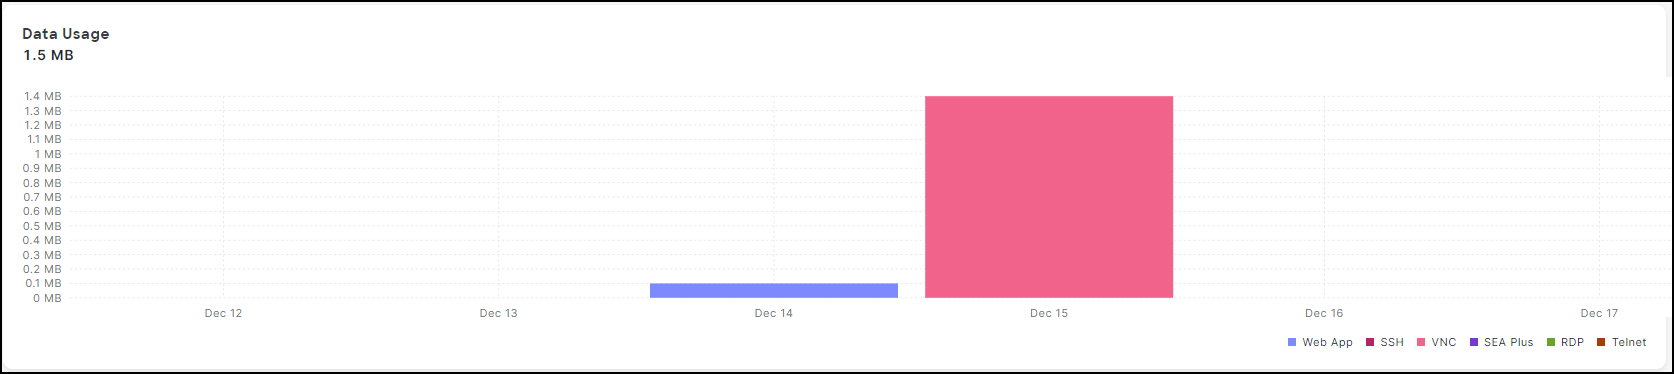
Data Usage
The Data Usage section of the SEA Dashboard shows what data is being utilized by Access Method (color coded), the Date when the data was utilized, and the Amount of data utilized.