View Events and Alerts
Alert: Cisco has made the end-of-life (EOL) announcement for the Cisco Edge Device Manager (EDM).
Use alerts to view the activity and status of your network devices in Edge Device Manager.
Permission requirements
To view events and alerts or have the dashlet show Open Alerts from the Dashboard menu, you must at least have one of the following permissions as part of one of your roles for that organization. See the roles and permissions defined in Add and Manage User Access.
- View Devices
- Manage Devices
For the View Devices permission, that user can perform the following actions with respect to Alerts and Events:
- View all the Active and Closed alerts for all the devices in my organizations
- Close any of the Active alerts so that they move to the Closed tab list
- View all the Events for all the devices in my organization
- View a summary of the Open Alerts on the Operations Dashboard
Note: Active and Open alerts are the same.
View an alert summary
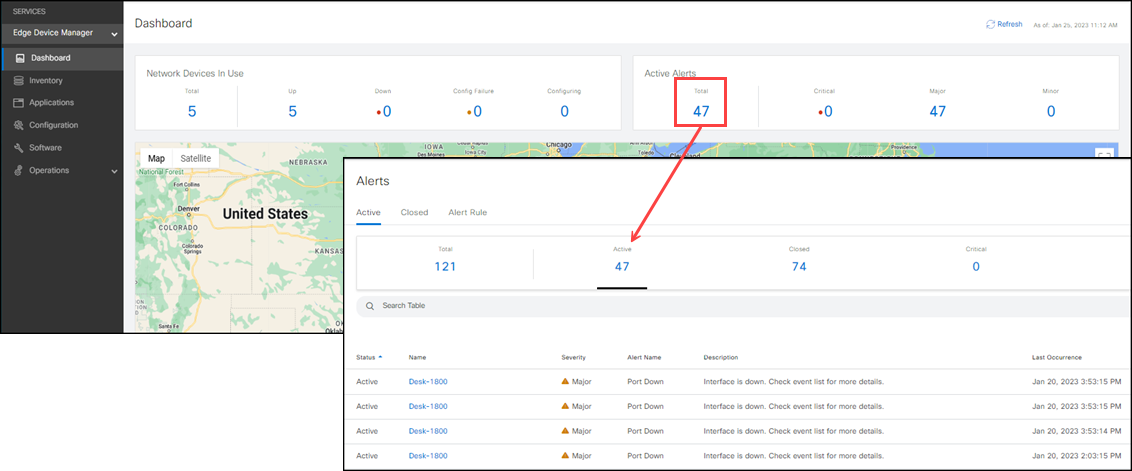
Click Dashboard to view a summary of the alerts and their status. Click a number to view the alerts in that status and view additional info about specific alerts.

View detailed alert information
From the left pane, click Operations > Alerts.
| Field | Description |
|---|---|
| Status | The status of the alert. It can be Active or Closed. |
| Device Name | The name of the device on which the alert occurs. |
| Severity | The severity of the alert. This can be CRITICAL (high), MAJOR (medium), or MINOR (low). |
| Alert Name | The type of alert. For example, down. |
| Description | The description of the alert. |
| Last Occurrence | The date and time when the alert last occurred. |
| First occurrence | The date and time when the alert first occurred. |
| Actions | Shows the alert details. Also allows you to close an alert manually. |
Note: To manage alert rules, see "Receive device alert notifications" in Manage Notifications.
View detailed event information
From the left pane, click Operations > Events.
Device-specific audit events are also displayed in this table. Use the Search bar to quickly locate information.
Click on the Search funnel icon and Severity and Type fields appear. Type in your string.
| Field | Description |
|---|---|
| Severity | The severity of the event, such as CRITICAL (high), MAJOR (medium) or MINOR (low). |
| Event Type | The type of event, such as Registration request, Configuration Rollback, DHCP Joined, etc. |
| Device Name | The name of the device on which the event occurs. |
| Event Time | The date and time when the event occurred. |
| Message | The description of the event. |
View Events in Inventory
For the IG device, there are three new Event Logs: Client Added, Client Removed, and Client Status Changed.
To see these, go to Inventory > pick a device from the list > click Event Log tab.
These are the three new Event Logs for the IG device:
- INFO: Client Status Changed: Changed status from <old-status> to <new-status> for <port-type> client <mac-address>
- INFO: Client Connected: Added <port-type> client <mac-address>
- INFO: Client Deleted: Removed client <mac-address>