View sensor details and troubleshoot
Alert: Cisco has made the end-of-life (EOL) announcement for the Cisco Industrial Asset Vision (IAV).
The sensors page shows the list of sensors filtered based on the Organization Hierarchy level that is selected. Only the levels accessible to the currently logged-in user are shown in bold text. Selecting a specific level in the hierarchy will filter the data and widget values of the sensors present under that hierarchy level and all of its child levels. The filtered sensors are displayed in the right pane of the page. If you select the Global level, then, all the sensors present for the tenant will be listed and the widget values are updated accordingly. The number next to a level is the Active Alerts (associated with all sensors, if any) count for that level which by default shows the aggregated alerts count (count of alerts on that level and the levels below). If you want to see only counts for the specific organization level, then, you click  located on the top of the organization hierarchy and select Local Alerts under Number Display. The Organization Hierarchy pane can be collapsed.
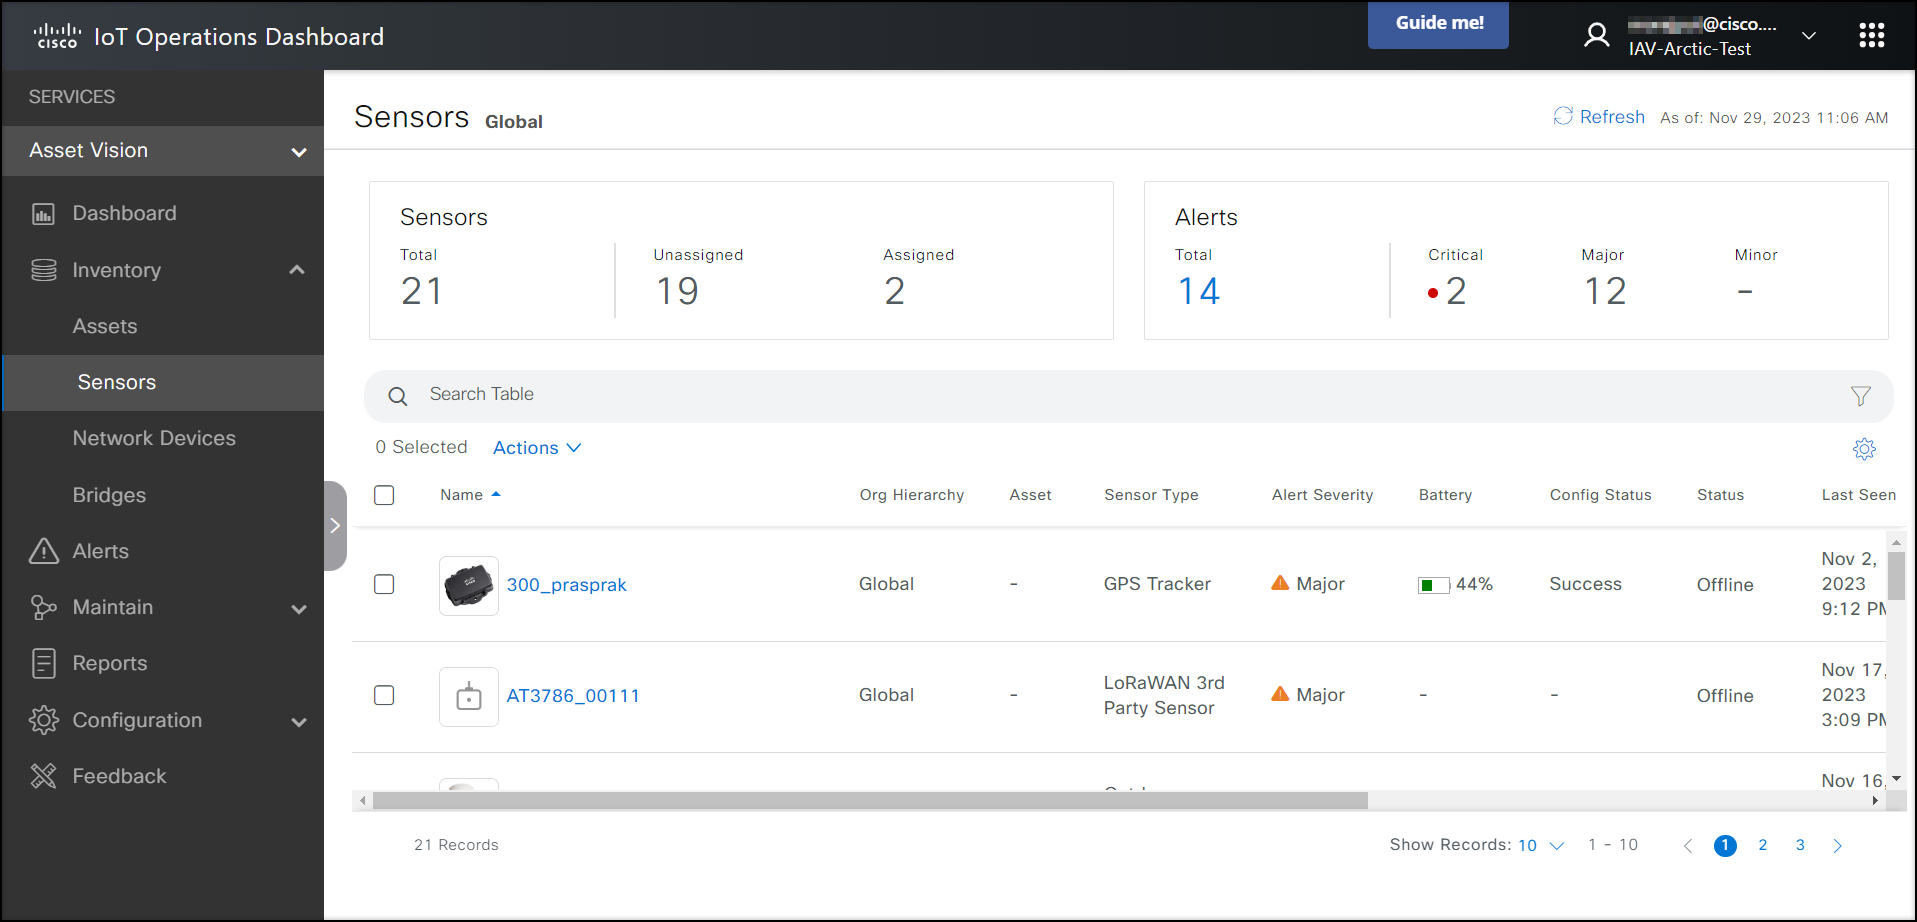
The sensor listing page shows all the sensors present in the inventory currently. These include sensors which are assigned to some asset, and the unassigned sensors.
Once you are on the inventory landing page, click on the Sensors tab to navigate to the sensor listing page.

The section displays the count of records and the list view of sensors present in the inventory.
| Column Header | Description |
|---|---|
| Name | Name provided to the sensor while onboarding |
| Org Hierarchy | The level in the hierarchy where the network device is present |
| Asset | The name of the asset with which the sensor is assigned |
| Manufacturer | Name of the manufacturer |
| Sensor Type | The type of Sensor. For example, GPS Tracker, Light Sensor, etc |
| Alert Severity | The highest severity of the alerts associated with the sensor (if multiple alerts are present for a sensor, the highest one will be shown) If no alert is generated for the sensor, then value is None |
| Battery | The Battery level of the sensor |
| Status | The current status of the sensor: * Inventory: The sensor has been claimed by a tenant. * Unheard: The sensor has been onboarded, but has not registered with IAV, yet. * Heard: The sensor has successfully registered with IAV, but IAV has not received a data payload from the sensor, yet. * Healthy: The sensor's battery level is >= 10% or signal strength >=1 bar * Unhealthy: The sensor's battery level < 10% or signal strength < 1 bar * Offline: The sensor has not sent any messages in the last 24 hours. |
| Last Seen | The timestamp at which the most recent message was received from the sensor |
| Applied Template | The template that is applied to the current sensor |
| Model | The model number of the Sensor |
| DevEUI | Unique ID of the sensor |
Move Org Hierarchy
Note: This feature is available to select EFT customers by request. Please contact your Cisco support representative for assistance.
- From the left pane click Inventory > Sensors > select one or more sensors to move to a different level in the Organization Hierarchy.
- Click Actions > Move Org Hierarchy.
- Select a level from the Assign Org Hierarchy list. Click
 to expand the hierarchy and
  to collapse the hierarchy. You can also search for the level in the Find Hierarchy search field above the hierarchy. Start typing to narrow down the search. Click Assign.
Notes:
- This action can be performed only for those sensors that have been onboarded but have not yet been assigned to any asset.
- Sensors assigned to an asset will always belong to the same hierarchy level as the asset.
- Sensors that are not yet onboarded will always belong to the Unused Level in the Organization Hierarchy.
Sensor Details
The sensor details page shows the Summary of the sensor details, Tracking details for a GPS sensor, Health details, Telemetry data, Troubleshooting details, and Message Inspector details of the sensor.
Summary
The summary tab displays the following:
The specifics of the sensor like temperature, humidity, the count of alerts, status, battery level, and signal strength. There is no battery level for 3rd party sensors.
A thumbnail image of the sensor.
The details of the sensor such as Name, DevEUI, Type, Model, the asset name with which the sensor is paired, Last Gateway connected to the network, The ID of the user that added the sensor, the ID of the user that modified the sensor details last, Last updated time of the sensor, Last seen timestamp.
Depending on the sensor, few additional attributes also get displayed such as RSSI (Received Signal Strength Indicator), SNR (Signal to Noise Ratio), SF (Spreading Factor)
The current location of the asset, on which the sensor is placed, can be seen on the map.
The trend of telemetry data of the asset in the Data Summary section.
- This section shows the line graph for the telemetry data of the sensor.
- The line graph shows Active alerts' (both acknowledged and unacknowledged alerts) data represented as small dots on the line. Hover over them to view the alert details. Different colored dots represent different severities - Red: Critical, Orange: Major; Yellow - Minor. The dots are plotted against the latest occurrence time of the alert and the details include the updated time and status.
Note: The alerts graph is not shown for the pulse counter sensor since alerts can't be applied to it.
- The Data Summary section also shows the first five alert threshold lines for the sensor. If there are more than five alert thresholds configured, then the first five are shown in the order of highest severity and created date. These are represented as dotted lines. The threshold values are provided in the respective legends, as shown below:

- For the pulse counter sensor, a graph with Trusted Data is shown. The shaded part of the graph is the time duration when the data received was Untrusted.

Tracking
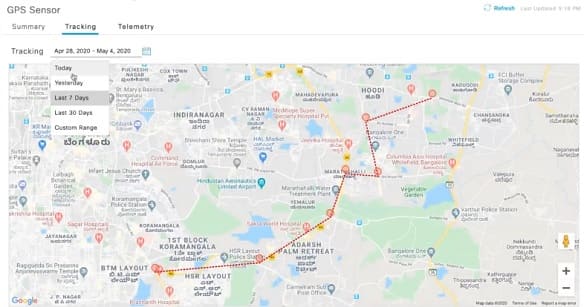
- This tab appears only for GPS tracking sensors (AV300).
- Clicking on Tracking tab displays the polyline on the map between different geo-coordinates recorded from the GPS sensor in the selected time period.
- You can select the time range from the datepicker, for which the sensor needs to be tracked.
- Each point shows the timestamp, latitude, and longitude of that point.

If no tracking information is available, then a message is displayed "Location Tracking not available".
Health

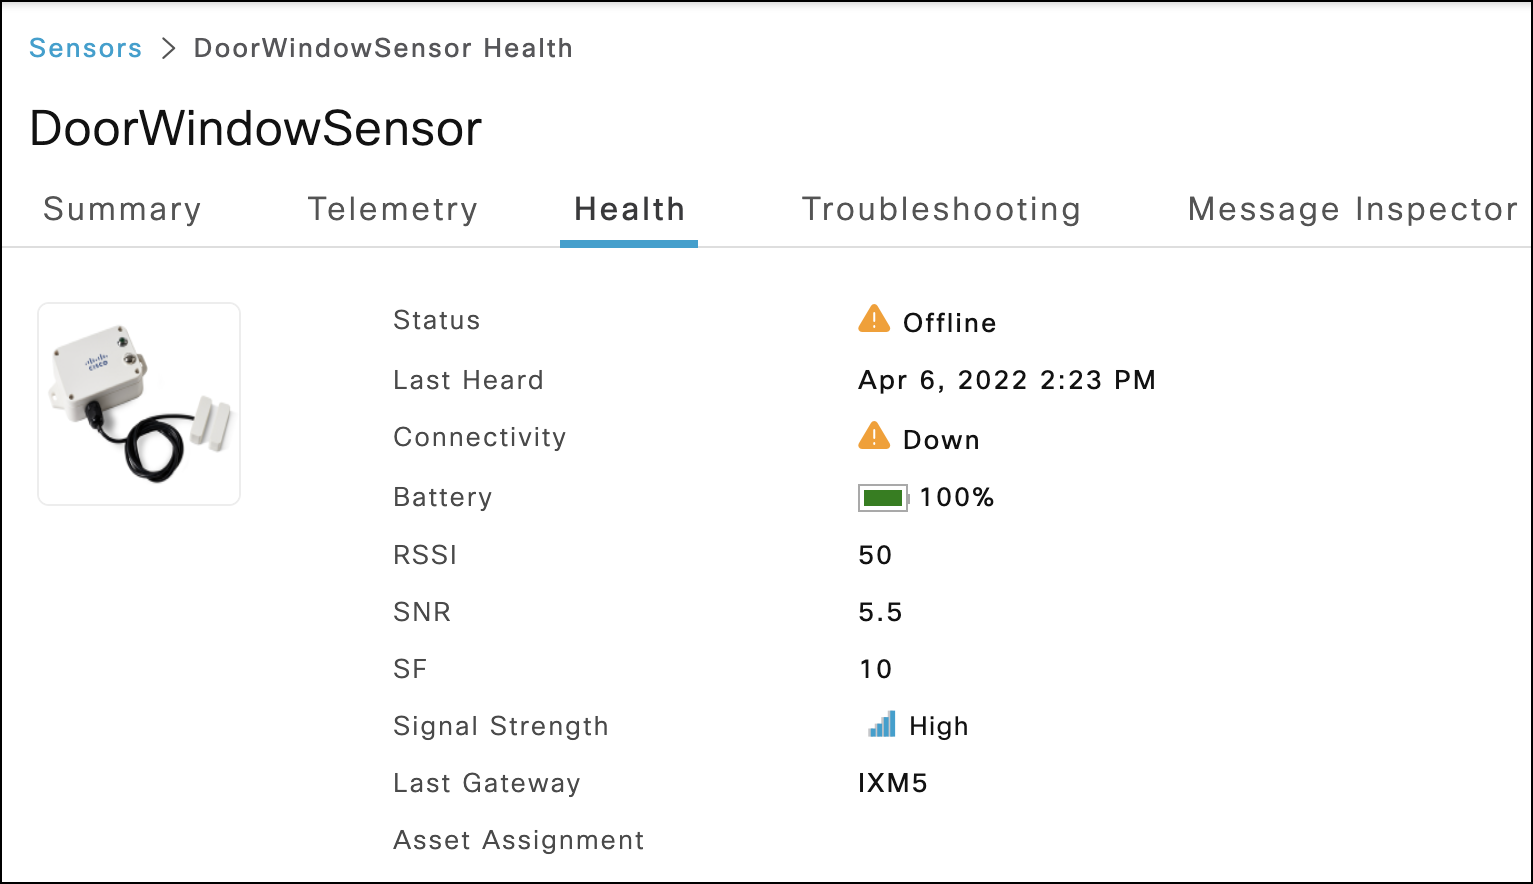
- The health tab shows info such as health status, connectivity, battery with percentage, RSSI (in dBm), SNR (in dB), SF (a value between 7 to 12) values of the sensor.
- You can check the details of the Asset to which the sensor is assigned by clicking Check Asset Assignment.
- This redirects you to the assigned asset's details page.
Telemetry
A tabular view of the telemetry data of the sensor can be seen on the telemetry tab. You can select the time period for which the data needs to be viewed.
Trusted data (for pulse counter)
This column shows if the received raw data from the sensor is trusted or not. The received data is called untrusted if the sensor connectivity is lost or restored. You can sync the untrusted data from the mobile app. Trigger the Sync Data action from the mobile app manually to synchronize the data.
See here to know more about the IAV mobile app.
To synchronize the untrusted data,
- Log in to the IAV mobile app and navigate to the Inventory screen. Select the Sensors tab.
- Scroll down to the pulse counting sensor. If the data is not synced, the text Data out of Sync and an error symbol
 is shown along with the other details.
 - Click on this pulse counter. The sensor details screen appears.
- Click Sync Data. A screen with more instructions appears.
Note: This button is enabled only if you have the Sync Pulse Data permission.
- After the process is completed, in the Enter data from meter screen, type in the meter value in the Enter the current value on the meter field.
Notes:
- You can enter decimal values also.
- If you don't want to continue from this step, click Exit on the top right corner of the screen. The Sensor details screen appears.
- Click Finish. The pulse counter sensor details page shows the updated values.
- Now, in the web UI, in the Telemetry screen, click Refresh in the top right corner. The table is updated with the latest values.
Note: You can sync data from the mobile app even if the data is not out of sync.
Raw Data
For 3rd party sensors, the data received from the sensors is the raw data.
The telemetry data can be exported to a CSV file.
Note: To view the special characters without any distortion, the downloaded CSV file should be opened with UTF-8 encoding.
Troubleshooting
The Troubleshooting tab can be used to analyze and troubleshoot a sensor. This tab shows the topological view of the network for all the sensors that have a status other than Inventory and Unheard.

- Hovering over each of the network elements shows the connection status.
- Hover over the connecting line between the operations center and the network devices. It shows the current status and last seen timestamp of the network management and the LoRaWAN.
- A blue line indicates connection status is fine.
- A red line indicates that either the status is offline or unhealthy.
- If the network device shows a red indicator, it means the device is offline. The green indicator shows that the device is online.
- The dotted line between the sensor and the network device shows the timestamp when the last signal was received on that path.
- If the sensor shows a red indicator, it means the sensor is offline or unhealthy. The green indicator shows that the sensor is online and healthy.
- Hover over the connecting line between the operations center and the network devices. It shows the current status and last seen timestamp of the network management and the LoRaWAN.
- Click Troubleshoot Now to know the Join Status, Battery Status, Reachability Status, and Signal Strength of the sensor.
Troubleshoot unheard sensors:
User can troubleshoot Unheard sensors.
Follow these steps:
- From the left pane click Inventory > Sensors and select required sensor.
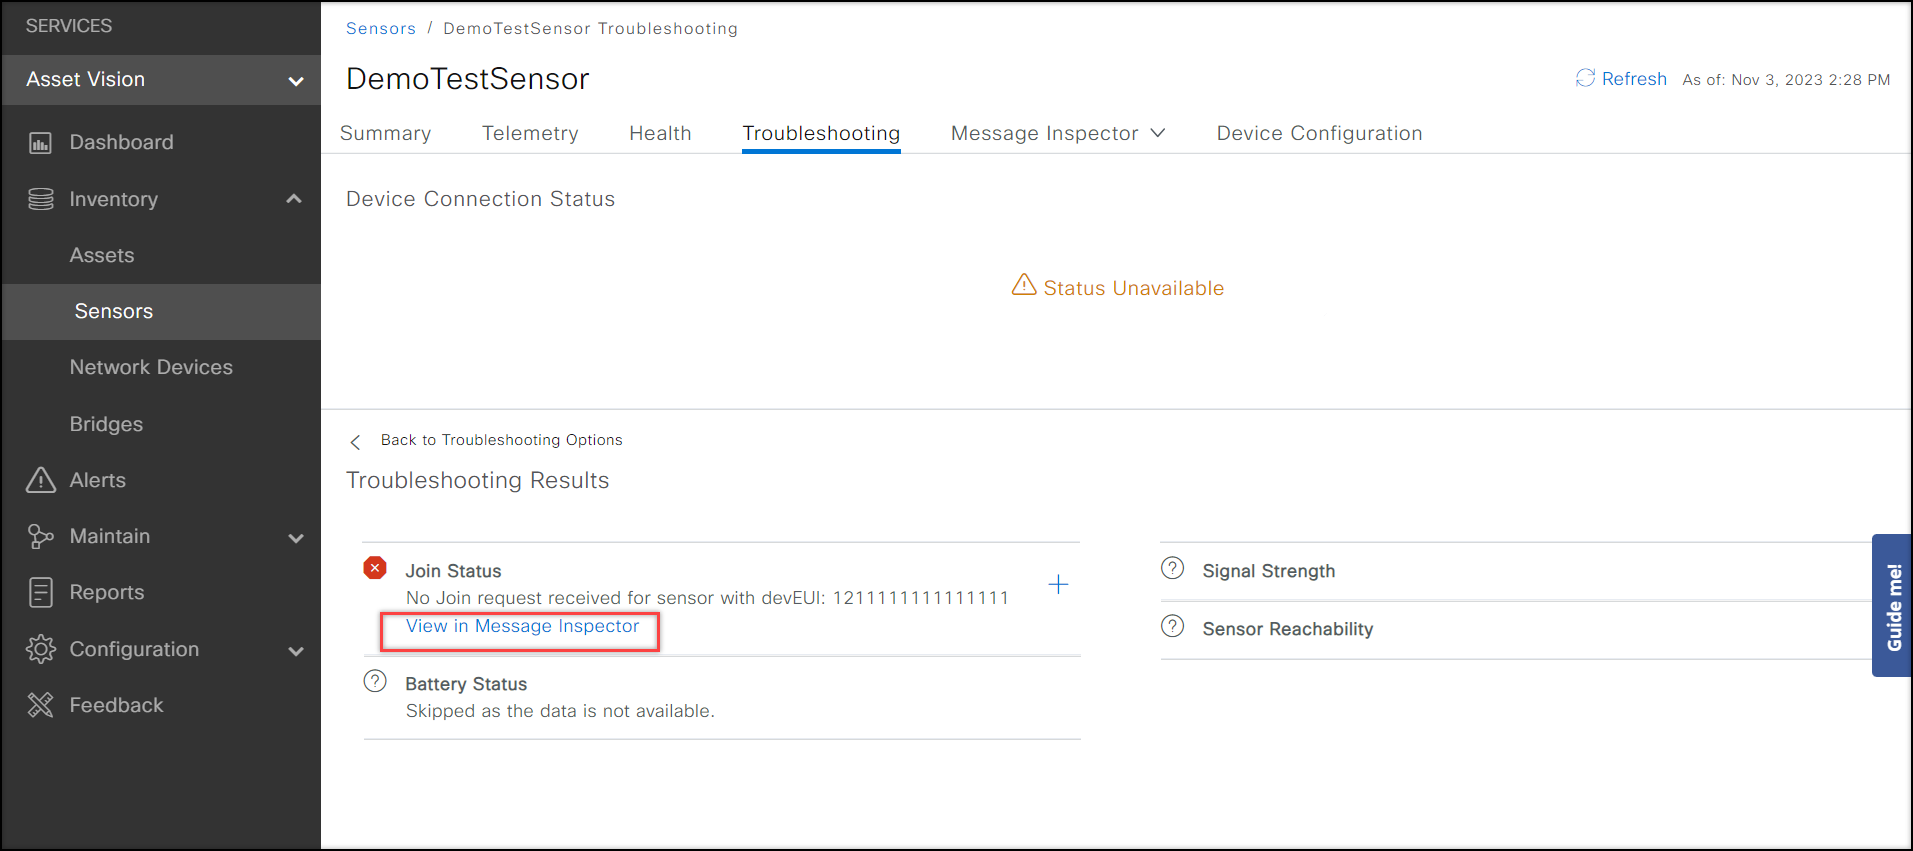
When the sensor is Unheard, you'll see this message: The sensor has not yet registered. Troubleshoot Now - Click Troubleshoot Now.
This page displays Join Status, Battery Status, Signal Strength, and Sensor Reachability. - Go to Join Status and click to troubleshoot sensor joining network.
- No Join Request
- It is a hardware issue (sensor or gateway)
- Join Request, but no Join Accept
- It is an AppKy mismatch
- Join Request, Join Accept, followed by another Join Request
- It is an RF issue (For example, the Gateway can detect sensors, but sensors cannot detect the Gateway.)
- No Join Request
- Click View in Message Inspector to troubleshoot further.
 You will be navigated to the LoRaWAN Frames page, which displays all the frames sent by the sensor.
Message Inspector
The Message Inspector will allow an experienced user to check the detailed packet-level information for the data that is sent by the sensors.
Message Inspector has a dropdown list with two options, which are:
LoRaWAN Frames:
Note: Latest 10 records will be shown.
Column Header Description Type The type of messages. They can be:
* Join — Join messages
* Up — Uplink messages (after decoding)
* Error — Error messages (in this case, the payload will have info of the actual error.)Time The time when the message is received. Frequency (Hz) It is the LoRa frequency. Port Field The sensor sends the payload using FPort. It identifies the end application or service. Uplink Frame Counter This is the Uplink Frame counter, and it will increase by 1 for each message it receives. Downlink Frame Counter This is the Down Frame counter, and it increases by 1 for each message it sends. RSSI (dbm) It is short for Received Signal Strength Indicator. It is measured in dBm and has a negative value. A value closer to 0 indicates that the signal is better. LoRa SNR (db) It is the Signal to Noise Ratio. It is measured in dB and is the ratio between the received power signal and noise floor power level. A value greater than 0 indicates that the received signal operates above the noise floor. Best Gateway This is the gateway that has the best received signal strength. Application Data:
Note: You can select the time period for which the data needs to be viewed.
Column Header Description Type The type of messages. They can be:
* Join — Join messages
* Up — Uplink messages (after decoding)
* Error — Error messages (in this case, the payload will have info of the actual error.)Time The time when the message is received. FPort The sensor sends the payload using FPort. It identifies the end application or service. FCount This is the Frame counter. The sensor uses this to increment the counter by 1 for each message that it sends. Frequency It is the LoRA frequency. RSSI It is short for Received Signal Strength Indicator. It is measured in dBm and has a negative value. A value closer to 0 indicates that the signal is better. Lora SNR It is the Signal to Noise Ratio. It is measured in dB and is the ratio between the received power signal and noise floor power level. A value greater than 0 indicates that the received signal operates above the noise floor. Data Rate Indicates the data rate for the message. It affects the Spreading factor and has a value between 0 to 5. Best Gateway This is the gateway that has the best received signal strength. For further information on each packet (such as the rawPayload, decoded data values, RSSI, SNR, device details, LoRA parameters such as Data rate, Adaptive Data rate, frame counter, etc.), click > in the Time column to expand the row.
Device Configuration
- From the left pane click Inventory > Sensors.
- Select sensor device.
- Click Device Configuration page tab.
This tab shows the unique configuration settings for the device. Here are the configuration settings:
- Config Status: It shows the configuration status.
- Push Config Info: It shows whether the configuration push was successful or not.
- Last Updated: It displays the date and time when the configuration was pushed.
- Template: It shows the template name linked to sensors.
- Downlink: Click Send Downlink tab to send a downlink.
The Device Configuration also shows the Device Specific Configuration Variables table that shows the status of the device configuration.
| Column Header | Description |
|---|---|
| Configuration | This shows the corresponding Running and Pending config values for: * The Uplink Interval for Cisco sensors AV200 to AV250 (not AV251—the vibration sensor doesn't support uplink/downlink) * The In Trip Reporting Interval and the Heartbeat/Out Of Trip Reporting Interval for the AV300 (GPS) sensor |
| Pending Config | The currently set Uplink/Downlink interval. |
| Running Config | The previously set Uplink/Downlink interval. |
Follow this procedure to send the downlink to third-party sensors:
- From the left pane click Inventory > Sensors.
- Click Device Configuration page tab and click Send Downlink.
Send Downlink page appears. - Enter the Payload and Port details.
Note: Get the Payload and Port details from the sensor documentation provided by the vendor.
- Click Send.
Go to the Device Configuration page to see updated configuration settings. - Click Message Inspector page tab and select LoRaWAN Frames from the drop-down list.
You will see confirm downlink messages on the page.Note: Users can only send a downlink to sensors that are currently online.